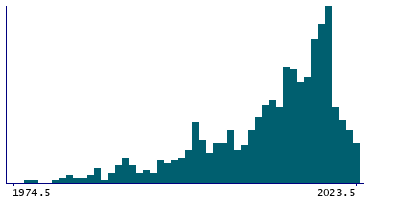
Data
64,798 items of data are available, covering 52,398 participants.
Some values have special meanings defined by Data-Coding
13.
Defined-instances run from 0 to 3, labelled using Instancing
2.
Array indices run from 0 to 5.
Units of measurement are years.
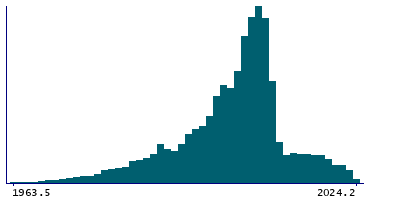
| Maximum | 2025.6 |
| Decile 9 | 2016.5 |
| Decile 8 | 2009.5 |
| Decile 7 | 2007.5 |
| Decile 6 | 2006.5 |
| Median | 2004.5 |
| Decile 4 | 2002.5 |
| Decile 3 | 1999.5 |
| Decile 2 | 1995.5 |
| Decile 1 | 1988.7 |
| Minimum | 1940.4 |
|
|
- Mean = 2002.98
- Std.dev = 10.4549
- 110 items below graph minimum of 1960.9
- 297 items have value -1 (Date uncertain or unknown)
|
4 Instances
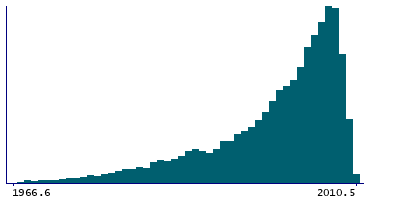
Instance 0 : Initial assessment visit (2006-2010) at which participants were recruited and consent given
41,658 participants, 44,653 items
| Maximum | 2010.5 |
| Decile 9 | 2008.4 |
| Decile 8 | 2006.5 |
| Decile 7 | 2005.5 |
| Decile 6 | 2004.5 |
| Median | 2002.5 |
| Decile 4 | 2000.5 |
| Decile 3 | 1997.5 |
| Decile 2 | 1993.5 |
| Decile 1 | 1987.5 |
| Minimum | 1940.4 |
|
|
- Mean = 1999.86
- Std.dev = 8.78865
- 209 items below graph minimum of 1966.6
- 100 items have value -1 (Date uncertain or unknown)
|
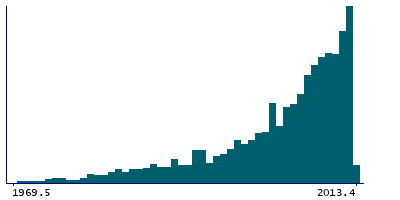
Instance 1 : First repeat assessment visit (2012-13)
2,277 participants, 2,427 items
| Maximum | 2013.4 |
| Decile 9 | 2011.5 |
| Decile 8 | 2010.5 |
| Decile 7 | 2009.5 |
| Decile 6 | 2008.5 |
| Median | 2006.5 |
| Decile 4 | 2004.5 |
| Decile 3 | 2001.5 |
| Decile 2 | 1997.5 |
| Decile 1 | 1990.5 |
| Minimum | 1950.5 |
|
|
- Mean = 2003.42
- Std.dev = 8.92511
- 3 items below graph minimum of 1969.5
- 3 items have value -1 (Date uncertain or unknown)
|
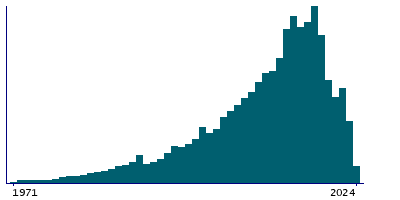
Instance 2 : Imaging visit (2014+)
13,765 participants, 15,042 items
| Maximum | 2025.6 |
| Decile 9 | 2021.5 |
| Decile 8 | 2019.5 |
| Decile 7 | 2017.5 |
| Decile 6 | 2015.5 |
| Median | 2013.5 |
| Decile 4 | 2010.5 |
| Decile 3 | 2007.5 |
| Decile 2 | 2003.2 |
| Decile 1 | 1995.8 |
| Minimum | 1948.9 |
|
|
- Mean = 2010.6
- Std.dev = 10.3441
- 29 items below graph minimum of 1970.1
- 83 items have value -1 (Date uncertain or unknown)
|
Instance 3 : First repeat imaging visit (2019+)
2,289 participants, 2,379 items
| Maximum | 2025.5 |
| Decile 9 | 2023.5 |
| Decile 8 | 2021.5 |
| Decile 7 | 2019.5 |
| Decile 6 | 2018.5 |
| Median | 2015.5 |
| Decile 4 | 2013.5 |
| Decile 3 | 2010.3 |
| Decile 2 | 2004.6 |
| Decile 1 | 1998.5 |
| Minimum | 1950.7 |
|
|
- Mean = 2012.91
- Std.dev = 10.339
- 6 items below graph minimum of 1973.5
- 111 items have value -1 (Date uncertain or unknown)
|
Notes
This is the interpolated time when the participant indicated the corresponding cancer was first diagnosed by a doctor, measured in years.
- If the participant gave a calendar year, then the best-fit time is half-way through that year. For example if the year was given as 1970, then the value presented is 1970.5
- If the participant gave their age then the value presented is the fractional year corresponding to the mid-point of that age. For example, if the participant said they were 30 years old then the value is the date at which they were 30years+6months.
- Interpolated values before the date of birth were truncated forwards to that time.
- Interpolated values after the time of data acquisition were truncated back to that time.
Coding 13 defines 2 special values:
- -1 represents "Date uncertain or unknown"
- -3 represents "Preferred not to answer"


