Data
643,191 items of data are available, covering 501,081 participants.
Some values have special meanings defined by Data-Coding
100373.
Defined-instances run from 0 to 3, labelled using Instancing
2.
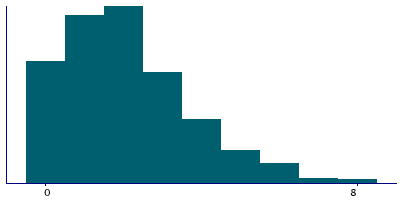
Units of measurement are cups/day.
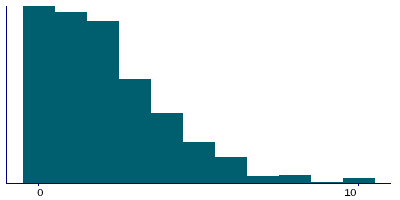
| Maximum | 80 |
| Decile 9 | 5 |
| Decile 8 | 4 |
| Decile 7 | 3 |
| Decile 6 | 2 |
| Median | 2 |
| Decile 4 | 1 |
| Decile 3 | 1 |
| Decile 2 | 0 |
| Decile 1 | 0 |
| Minimum | 0 |
|
|
- There are 42 distinct values.
- Mean = 2.12738
- Std.dev = 2.06307
- 1559 items above graph maximum of 10
- 45541 items have value -10 (Less than one)
- 423 items have value -3 (Prefer not to answer)
- 1024 items have value -1 (Do not know)
|
4 Instances
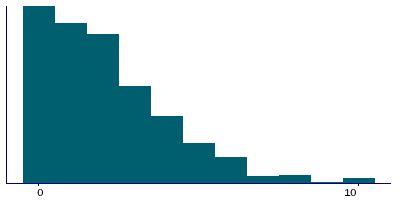
Instance 0 : Initial assessment visit (2006-2010) at which participants were recruited and consent given
501,040 participants, 501,040 items
| Maximum | 80 |
| Decile 9 | 5 |
| Decile 8 | 4 |
| Decile 7 | 3 |
| Decile 6 | 2 |
| Median | 2 |
| Decile 4 | 1 |
| Decile 3 | 1 |
| Decile 2 | 0 |
| Decile 1 | 0 |
| Minimum | 0 |
|
|
- There are 41 distinct values.
- Mean = 2.13369
- Std.dev = 2.12662
- 1370 items above graph maximum of 10
- 36270 items have value -10 (Less than one)
- 401 items have value -3 (Prefer not to answer)
- 968 items have value -1 (Do not know)
|
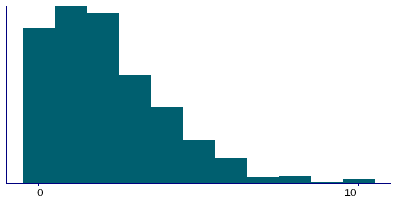
Instance 1 : First repeat assessment visit (2012-13)
20,314 participants, 20,314 items
| Maximum | 36 |
| Decile 9 | 5 |
| Decile 8 | 4 |
| Decile 7 | 3 |
| Decile 6 | 2 |
| Median | 2 |
| Decile 4 | 1 |
| Decile 3 | 1 |
| Decile 2 | 0 |
| Decile 1 | 0 |
| Minimum | 0 |
|
|
- There are 23 distinct values.
- Mean = 2.18854
- Std.dev = 2.02484
- 46 items above graph maximum of 10
- 1511 items have value -10 (Less than one)
- 2 items have value -3 (Prefer not to answer)
- 9 items have value -1 (Do not know)
|
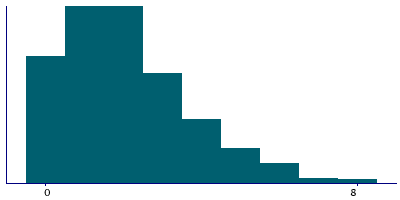
Instance 2 : Imaging visit (2014+)
100,917 participants, 100,917 items
| Maximum | 70 |
| Decile 9 | 4 |
| Decile 8 | 3 |
| Decile 7 | 3 |
| Decile 6 | 2 |
| Median | 2 |
| Decile 4 | 1 |
| Decile 3 | 1 |
| Decile 2 | 1 |
| Decile 1 | 0 |
| Minimum | 0 |
|
|
- There are 27 distinct values.
- Mean = 2.08941
- Std.dev = 1.79807
- 480 items above graph maximum of 8
- 6521 items have value -10 (Less than one)
- 17 items have value -3 (Prefer not to answer)
- 40 items have value -1 (Do not know)
|
Instance 3 : First repeat imaging visit (2019+)
20,920 participants, 20,920 items
| Maximum | 21 |
| Decile 9 | 4 |
| Decile 8 | 3 |
| Decile 7 | 3 |
| Decile 6 | 2 |
| Median | 2 |
| Decile 4 | 1 |
| Decile 3 | 1 |
| Decile 2 | 1 |
| Decile 1 | 0 |
| Minimum | 0 |
|
|
- There are 18 distinct values.
- Mean = 2.10228
- Std.dev = 1.74033
- 100 items above graph maximum of 8
- 1239 items have value -10 (Less than one)
- 3 items have value -3 (Prefer not to answer)
- 7 items have value -1 (Do not know)
|
Notes
ACE touchscreen question "How many cups of coffee do you drink each DAY? (Include decaffeinated coffee)"
The following checks were performed:
- If answer < 0 then rejected
- If answer > 99 then rejected
- If answer > 10 then participant asked to confirm
If the participant activated the Help button they were shown the message:
Please provide an average considering your intake over the last year.
If you are unsure, please provide an estimate or select Do not know.
|
Coding 100373 defines 3 special values:
- -10 represents "Less than one"
- -1 represents "Do not know"
- -3 represents "Prefer not to answer"


