Data
624,749 items of data are available, covering 501,109 participants.
Defined-instances run from 0 to 3, labelled using Instancing
2.
| Maximum | 48 |
| Decile 9 | 6 |
| Decile 8 | 4 |
| Decile 7 | 3 |
| Decile 6 | 2 |
| Median | 2 |
| Decile 4 | 1 |
| Decile 3 | 1 |
| Decile 2 | 0 |
| Decile 1 | 0 |
| Minimum | 0 |
|
|
- There are 33 distinct values.
- Mean = 2.42068
- Std.dev = 2.6303
- 3922 items above graph maximum of 12
|
4 Instances
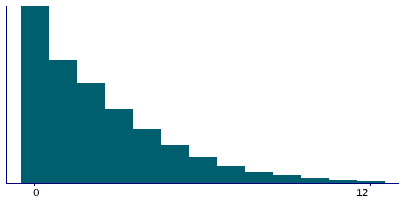
Instance 0 : Initial assessment visit (2006-2010) at which participants were recruited and consent given
501,076 participants, 501,076 items
| Maximum | 48 |
| Decile 9 | 6 |
| Decile 8 | 4 |
| Decile 7 | 3 |
| Decile 6 | 2 |
| Median | 2 |
| Decile 4 | 1 |
| Decile 3 | 1 |
| Decile 2 | 0 |
| Decile 1 | 0 |
| Minimum | 0 |
|

|
- There are 33 distinct values.
- Mean = 2.4603
- Std.dev = 2.68129
- 3451 items above graph maximum of 12
|
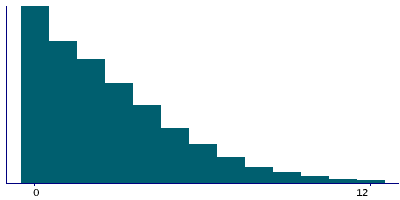
Instance 1 : First repeat assessment visit (2012-13)
20,313 participants, 20,313 items
| Maximum | 28 |
| Decile 9 | 6 |
| Decile 8 | 5 |
| Decile 7 | 4 |
| Decile 6 | 3 |
| Median | 2 |
| Decile 4 | 1 |
| Decile 3 | 1 |
| Decile 2 | 0 |
| Decile 1 | 0 |
| Minimum | 0 |
|
|
- There are 25 distinct values.
- Mean = 2.73687
- Std.dev = 2.71582
- 143 items above graph maximum of 12
|
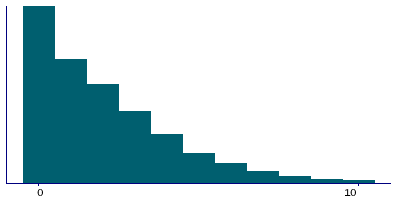
Instance 2 : Imaging visit (2014+)
89,066 participants, 89,066 items
| Maximum | 30 |
| Decile 9 | 5 |
| Decile 8 | 4 |
| Decile 7 | 3 |
| Decile 6 | 2 |
| Median | 2 |
| Decile 4 | 1 |
| Decile 3 | 1 |
| Decile 2 | 0 |
| Decile 1 | 0 |
| Minimum | 0 |
|
|
- There are 28 distinct values.
- Mean = 2.14955
- Std.dev = 2.3244
- 720 items above graph maximum of 10
|
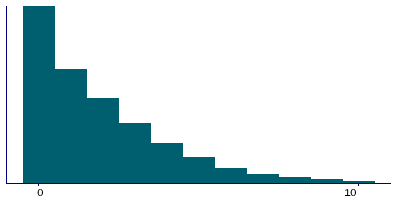
Instance 3 : First repeat imaging visit (2019+)
14,294 participants, 14,294 items
| Maximum | 21 |
| Decile 9 | 5 |
| Decile 8 | 4 |
| Decile 7 | 3 |
| Decile 6 | 2 |
| Median | 2 |
| Decile 4 | 1 |
| Decile 3 | 1 |
| Decile 2 | 0 |
| Decile 1 | 0 |
| Minimum | 0 |
|
|
- There are 20 distinct values.
- Mean = 2.272
- Std.dev = 2.35398
- 107 items above graph maximum of 10
|

