Data
104,537 items of data are available, covering 88,454 participants.
Defined-instances run from 2 to 3, labelled using Instancing
2.
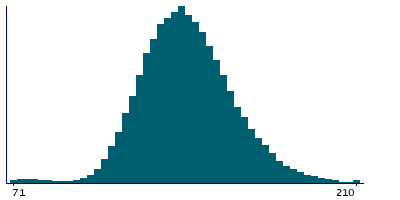
Units of measurement are mmHg.
| Maximum | 210 |
| Decile 9 | 166 |
| Decile 8 | 156 |
| Decile 7 | 150 |
| Decile 6 | 145 |
| Median | 141 |
| Decile 4 | 136 |
| Decile 3 | 131 |
| Decile 2 | 126 |
| Decile 1 | 119 |
| Minimum | 8 |
|
|
- There are 202 distinct values.
- Mean = 140.734
- Std.dev = 21.0789
- 1130 items below graph minimum of 72
|
2 Instances
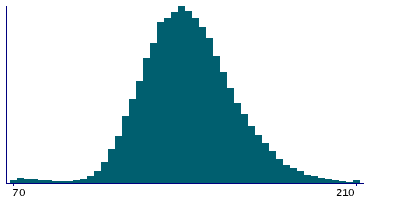
Instance 2 : Imaging visit (2014+)
85,895 participants, 85,895 items
| Maximum | 210 |
| Decile 9 | 166 |
| Decile 8 | 157 |
| Decile 7 | 150 |
| Decile 6 | 145 |
| Median | 141 |
| Decile 4 | 136 |
| Decile 3 | 131 |
| Decile 2 | 126 |
| Decile 1 | 119 |
| Minimum | 8 |
|
|
- There are 202 distinct values.
- Mean = 140.768
- Std.dev = 21.2536
- 972 items below graph minimum of 72
|
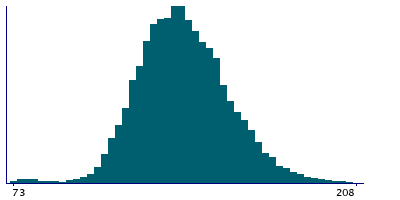
Instance 3 : First repeat imaging visit (2019+)
18,642 participants, 18,642 items
| Maximum | 210 |
| Decile 9 | 165 |
| Decile 8 | 156 |
| Decile 7 | 150 |
| Decile 6 | 145 |
| Median | 140 |
| Decile 4 | 136 |
| Decile 3 | 131 |
| Decile 2 | 126 |
| Decile 1 | 119 |
| Minimum | 11 |
|
|
- There are 186 distinct values.
- Mean = 140.577
- Std.dev = 20.2537
- 171 items below graph minimum of 73
|
Notes
Systolic brachial blood pressure during blood pressure test.
0 Related Data-Fields
There are no related data-fields

