Data
197,111 items of data are available, covering 86,494 participants.
Defined-instances run from 2 to 3, labelled using Instancing
2.
Array indices run from 0 to 5.
Units of measurement are mL.
| Maximum | 424 |
| Decile 9 | 170 |
| Decile 8 | 150 |
| Decile 7 | 137 |
| Decile 6 | 126 |
| Median | 118 |
| Decile 4 | 109 |
| Decile 3 | 101 |
| Decile 2 | 92 |
| Decile 1 | 80 |
| Minimum | -148 |
|

|
- There are 360 distinct values.
- Mean = 120.935
- Std.dev = 38.7381
- 36 items below graph minimum of -10
- 450 items above graph maximum of 260
|
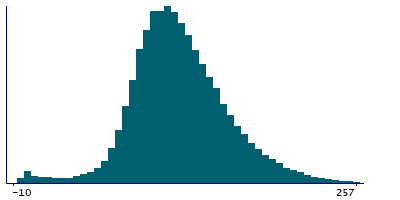
2 Instances
Instance 2 : Imaging visit (2014+)
83,721 participants, 161,482 items
| Maximum | 424 |
| Decile 9 | 170 |
| Decile 8 | 150 |
| Decile 7 | 136 |
| Decile 6 | 126 |
| Median | 117 |
| Decile 4 | 109 |
| Decile 3 | 101 |
| Decile 2 | 92 |
| Decile 1 | 79 |
| Minimum | -148 |
|
|
- There are 354 distinct values.
- Mean = 120.547
- Std.dev = 39.0311
- 30 items below graph minimum of -12
- 348 items above graph maximum of 261
|
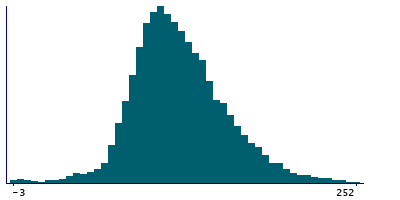
Instance 3 : First repeat imaging visit (2019+)
18,289 participants, 35,629 items
| Maximum | 392 |
| Decile 9 | 169 |
| Decile 8 | 151 |
| Decile 7 | 138 |
| Decile 6 | 128 |
| Median | 119 |
| Decile 4 | 111 |
| Decile 3 | 103 |
| Decile 2 | 95 |
| Decile 1 | 83 |
| Minimum | -99 |
|
|
- There are 307 distinct values.
- Mean = 122.697
- Std.dev = 37.3307
- 7 items below graph minimum of -3
- 107 items above graph maximum of 255
|
Notes
Stroke volume during PWA
Note that this field is arrayed to enable representation of the 5 measures of BP acquired during and immediately after the Aortic Distensibility image acquisiton.
0 Related Data-Fields
There are no related data-fields

