Data
205,421 items of data are available, covering 87,965 participants.
Defined-instances run from 2 to 3, labelled using Instancing
2.
Array indices run from 0 to 5.
Units of measurement are mmHg.
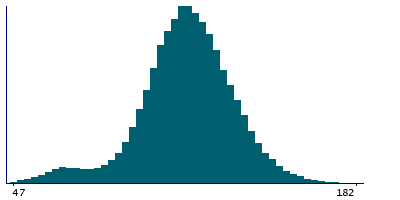
| Maximum | 235 |
| Decile 9 | 137 |
| Decile 8 | 129 |
| Decile 7 | 124 |
| Decile 6 | 120 |
| Median | 116 |
| Decile 4 | 112 |
| Decile 3 | 107 |
| Decile 2 | 102 |
| Decile 1 | 92 |
| Minimum | -76 |
|
|
- Mean = 114.431
- Std.dev = 19.5902
- 910 items below graph minimum of 47
- 49 items above graph maximum of 182
|
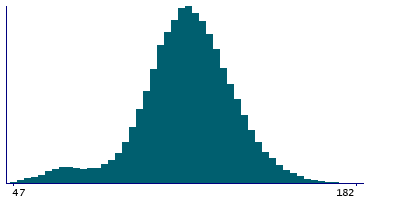
2 Instances
Instance 2 : Imaging visit (2014+)
85,276 participants, 168,688 items
| Maximum | 235 |
| Decile 9 | 137 |
| Decile 8 | 130 |
| Decile 7 | 124 |
| Decile 6 | 120 |
| Median | 116 |
| Decile 4 | 112 |
| Decile 3 | 107 |
| Decile 2 | 102 |
| Decile 1 | 92 |
| Minimum | -76 |
|
|
- Mean = 114.452
- Std.dev = 19.8206
- 780 items below graph minimum of 47
- 43 items above graph maximum of 182
|
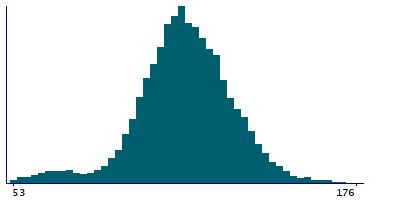
Instance 3 : First repeat imaging visit (2019+)
18,564 participants, 36,733 items
| Maximum | 207 |
| Decile 9 | 136 |
| Decile 8 | 128 |
| Decile 7 | 123 |
| Decile 6 | 119 |
| Median | 115 |
| Decile 4 | 111 |
| Decile 3 | 107 |
| Decile 2 | 102 |
| Decile 1 | 94 |
| Minimum | -17 |
|
|
- Mean = 114.336
- Std.dev = 18.495
- 175 items below graph minimum of 52
- 8 items above graph maximum of 178
|
Notes
End systolic pressure during PWA
Note that this field is arrayed to enable representation of the 5 measures of BP acquired during and immediately after the Aortic Distensibility image acquisiton.
1 Related Data-Field
| Field ID | Description | Relationship |
|---|
| 12684 | End systolic pressure index during P ... | Field 12684 is partly derived from Current Field |

