Data
205,719 items of data are available, covering 88,065 participants.
Defined-instances run from 2 to 3, labelled using Instancing
2.
Array indices run from 0 to 5.
Units of measurement are mmHg.
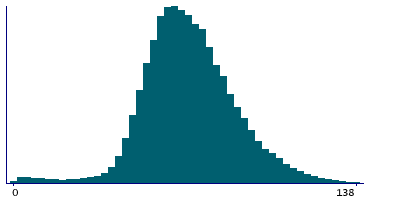
| Maximum | 165 |
| Decile 9 | 95 |
| Decile 8 | 86 |
| Decile 7 | 80 |
| Decile 6 | 75 |
| Median | 70 |
| Decile 4 | 66 |
| Decile 3 | 62 |
| Decile 2 | 57 |
| Decile 1 | 51 |
| Minimum | -114 |
|
|
- There are 195 distinct values.
- Mean = 71.4461
- Std.dev = 18.8639
- 143 items below graph minimum of 0
- 214 items above graph maximum of 139
|
2 Instances
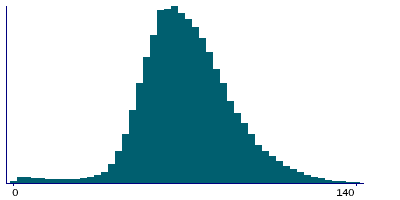
Instance 2 : Imaging visit (2014+)
85,409 participants, 168,943 items
| Maximum | 165 |
| Decile 9 | 96 |
| Decile 8 | 86 |
| Decile 7 | 80 |
| Decile 6 | 75 |
| Median | 70 |
| Decile 4 | 66 |
| Decile 3 | 62 |
| Decile 2 | 57 |
| Decile 1 | 51 |
| Minimum | -114 |
|
|
- There are 190 distinct values.
- Mean = 71.4529
- Std.dev = 19.1106
- 127 items below graph minimum of 0
- 123 items above graph maximum of 141
|
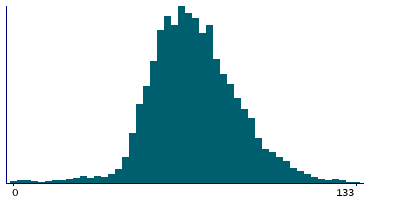
Instance 3 : First repeat imaging visit (2019+)
18,587 participants, 36,776 items
| Maximum | 162 |
| Decile 9 | 93 |
| Decile 8 | 85 |
| Decile 7 | 79 |
| Decile 6 | 75 |
| Median | 70 |
| Decile 4 | 66 |
| Decile 3 | 62 |
| Decile 2 | 58 |
| Decile 1 | 52 |
| Minimum | -56 |
|
|
- There are 162 distinct values.
- Mean = 71.415
- Std.dev = 17.6865
- 16 items below graph minimum of 0
- 67 items above graph maximum of 134
|
Notes
Peripheral pulse pressure during PWA
Note that this field is arrayed to enable representation of the 5 measures of BP acquired during and immediately after the Aortic Distensibility image acquisiton.
2 Related Data-Fields
| Field ID | Description | Relationship |
|---|
| 12681 | Augmentation index for PWA - PVR | Field 12681 is partly derived from Current Field |
| 12684 | End systolic pressure index during P ... | Field 12684 is partly derived from Current Field |

