Data
109,933 items of data are available, covering 95,178 participants.
Defined-instances run from 2 to 3, labelled using Instancing
2.
Units of measurement are bpm.
| Maximum | 213 |
| Decile 9 | 75 |
| Decile 8 | 70 |
| Decile 7 | 66 |
| Decile 6 | 63 |
| Median | 61 |
| Decile 4 | 58 |
| Decile 3 | 56 |
| Decile 2 | 53 |
| Decile 1 | 50 |
| Minimum | 0 |
|

|
- There are 154 distinct values.
- Mean = 61.9643
- Std.dev = 10.882
- 19 items below graph minimum of 25
- 468 items above graph maximum of 100
|
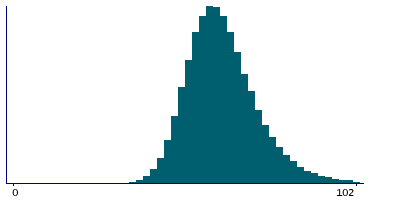
2 Instances
Instance 2 : Imaging visit (2014+)
92,349 participants, 92,349 items
| Maximum | 211 |
| Decile 9 | 76 |
| Decile 8 | 70 |
| Decile 7 | 66 |
| Decile 6 | 63 |
| Median | 61 |
| Decile 4 | 59 |
| Decile 3 | 56 |
| Decile 2 | 53 |
| Decile 1 | 50 |
| Minimum | 0 |
|
|
- There are 147 distinct values.
- Mean = 62.0938
- Std.dev = 10.9241
- 324 items above graph maximum of 102
|
Instance 3 : First repeat imaging visit (2019+)
17,584 participants, 17,584 items
| Maximum | 213 |
| Decile 9 | 74 |
| Decile 8 | 69 |
| Decile 7 | 66 |
| Decile 6 | 63 |
| Median | 60 |
| Decile 4 | 58 |
| Decile 3 | 55 |
| Decile 2 | 53 |
| Decile 1 | 49 |
| Minimum | 0 |
|

|
- There are 95 distinct values.
- Mean = 61.2845
- Std.dev = 10.6318
- 76 items above graph maximum of 99
|
Notes
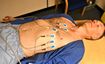
Ventricular rate during ECG measurement.
0 Related Data-Fields
There are no related data-fields