Data
122,854 items of data are available, covering 101,798 participants.
Defined-instances run from 2 to 3, labelled using Instancing
2.
Units of measurement are Kg.
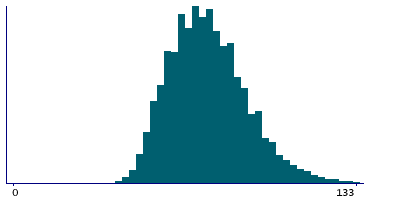
| Maximum | 233 |
| Decile 9 | 95 |
| Decile 8 | 87 |
| Decile 7 | 82 |
| Decile 6 | 78 |
| Median | 74 |
| Decile 4 | 70 |
| Decile 3 | 66 |
| Decile 2 | 62 |
| Decile 1 | 57 |
| Minimum | 34 |
|
|
- There are 138 distinct values.
- Mean = 75.5877
- Std.dev = 15.4084
- 351 items above graph maximum of 133
|
2 Instances
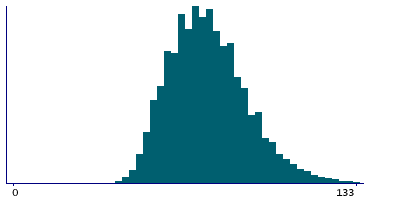
Instance 2 : Imaging visit (2014+)
101,793 participants, 101,793 items
| Maximum | 200 |
| Decile 9 | 95 |
| Decile 8 | 88 |
| Decile 7 | 82 |
| Decile 6 | 78 |
| Median | 74 |
| Decile 4 | 70 |
| Decile 3 | 66 |
| Decile 2 | 62 |
| Decile 1 | 57 |
| Minimum | 34 |
|
|
- There are 134 distinct values.
- Mean = 75.6303
- Std.dev = 15.4737
- 302 items above graph maximum of 133
|
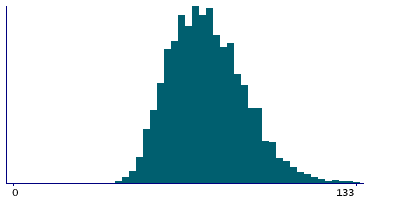
Instance 3 : First repeat imaging visit (2019+)
21,061 participants, 21,061 items
| Maximum | 233 |
| Decile 9 | 95 |
| Decile 8 | 87 |
| Decile 7 | 82 |
| Decile 6 | 78 |
| Median | 74 |
| Decile 4 | 70 |
| Decile 3 | 66 |
| Decile 2 | 62 |
| Decile 1 | 57 |
| Minimum | 35 |
|
|
- There are 120 distinct values.
- Mean = 75.382
- Std.dev = 15.087
- 49 items above graph maximum of 133
|
Notes
Weight measured prior to imaging stages. Required by DXA device for calibration.
1 Related Data-Field
| Field ID | Description | Relationship |
|---|
| 21002 | Weight | Field 21002 should be used in preference to Current Field |
1 Application
| Application ID | Title |
|---|
| 9502 | Assessing whether individual feedback results in improved health outcomes, with a focus on BMI feedback. |

