Data
643,205 items of data are available, covering 501,094 participants.
Some values have special meanings defined by Data-Coding
100329.
Defined-instances run from 0 to 3, labelled using Instancing
2.
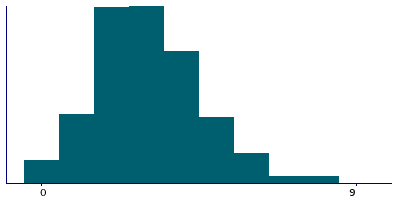
Units of measurement are hours/day.
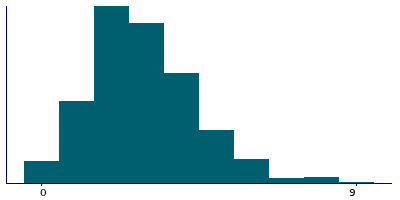
| Maximum | 24 |
| Decile 9 | 5 |
| Decile 8 | 4 |
| Decile 7 | 4 |
| Decile 6 | 3 |
| Median | 3 |
| Decile 4 | 2 |
| Decile 3 | 2 |
| Decile 2 | 2 |
| Decile 1 | 1 |
| Minimum | 0 |
|
|
- There are 24 distinct values.
- Mean = 2.93102
- Std.dev = 1.62286
- 2185 items above graph maximum of 9
- 28129 items have value -10 (Less than an hour a day)
- 833 items have value -3 (Prefer not to answer)
- 4187 items have value -1 (Do not know)
|
4 Instances
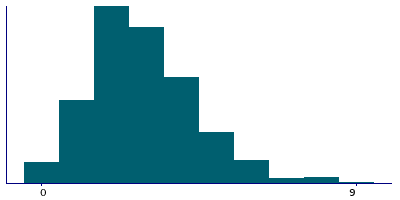
Instance 0 : Initial assessment visit (2006-2010) at which participants were recruited and consent given
501,054 participants, 501,054 items
| Maximum | 24 |
| Decile 9 | 5 |
| Decile 8 | 4 |
| Decile 7 | 4 |
| Decile 6 | 3 |
| Median | 3 |
| Decile 4 | 2 |
| Decile 3 | 2 |
| Decile 2 | 2 |
| Decile 1 | 1 |
| Minimum | 0 |
|
|
- There are 24 distinct values.
- Mean = 2.91264
- Std.dev = 1.63788
- 1902 items above graph maximum of 9
- 23333 items have value -10 (Less than an hour a day)
- 757 items have value -3 (Prefer not to answer)
- 3769 items have value -1 (Do not know)
|
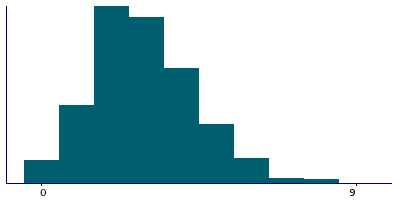
Instance 1 : First repeat assessment visit (2012-13)
20,314 participants, 20,314 items
| Maximum | 17 |
| Decile 9 | 5 |
| Decile 8 | 4 |
| Decile 7 | 4 |
| Decile 6 | 3 |
| Median | 3 |
| Decile 4 | 2 |
| Decile 3 | 2 |
| Decile 2 | 2 |
| Decile 1 | 1 |
| Minimum | 0 |
|
|
- There are 15 distinct values.
- Mean = 2.94047
- Std.dev = 1.5612
- 47 items above graph maximum of 9
- 877 items have value -10 (Less than an hour a day)
- 6 items have value -3 (Prefer not to answer)
- 64 items have value -1 (Do not know)
|
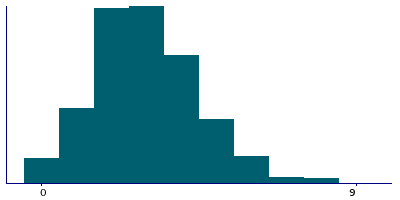
Instance 2 : Imaging visit (2014+)
100,917 participants, 100,917 items
| Maximum | 20 |
| Decile 9 | 5 |
| Decile 8 | 4 |
| Decile 7 | 4 |
| Decile 6 | 3 |
| Median | 3 |
| Decile 4 | 2 |
| Decile 3 | 2 |
| Decile 2 | 2 |
| Decile 1 | 1 |
| Minimum | 0 |
|
|
- There are 19 distinct values.
- Mean = 2.97631
- Std.dev = 1.56298
- 198 items above graph maximum of 9
- 3362 items have value -10 (Less than an hour a day)
- 63 items have value -3 (Prefer not to answer)
- 304 items have value -1 (Do not know)
|
Instance 3 : First repeat imaging visit (2019+)
20,920 participants, 20,920 items
| Maximum | 20 |
| Decile 9 | 5 |
| Decile 8 | 4 |
| Decile 7 | 4 |
| Decile 6 | 3 |
| Median | 3 |
| Decile 4 | 3 |
| Decile 3 | 2 |
| Decile 2 | 2 |
| Decile 1 | 1 |
| Minimum | 0 |
|
|
- There are 19 distinct values.
- Mean = 3.13346
- Std.dev = 1.59178
- 38 items above graph maximum of 9
- 557 items have value -10 (Less than an hour a day)
- 7 items have value -3 (Prefer not to answer)
- 50 items have value -1 (Do not know)
|
Notes
ACE touchscreen question "In a typical DAY, how many hours do you spend watching TV? (Put 0 if you do not spend any time doing it)"
The following checks were performed:
- If answer < 0 then rejected
- If answer > 24 then rejected
- If answer > 8 then participant asked to confirm
If the participant activated the Help button they were shown the message:
If the time you spend watching TV varies a lot, give
the average time for a 24 hour day in the last 4 weeks.
|
Coding 100329 defines 3 special values:
- -10 represents "Less than an hour a day"
- -1 represents "Do not know"
- -3 represents "Prefer not to answer"
0 Related Data-Fields
There are no related data-fields
2 Applications
| Application ID | Title |
|---|
| 3173 | A multi-level approach to better understand the association between physical activity and sedentary behaviour, and cancer risk. |
| 4483 | Identification of modifiable and non-modifiable correlates of sedentary behaviours and physical activity in adults aged =65 years |


