Data
134,414 items of data are available, covering 12,955 participants.
Defined-instances run from 2 to 3, labelled using Instancing
2.
Array indices run from 1 to 10.
Units of measurement are dioptre.
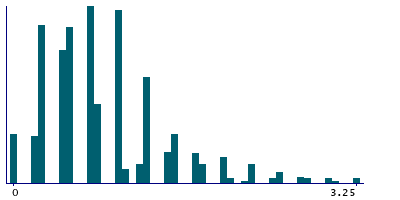
| Maximum | 12 |
| Decile 9 | 1.75 |
| Decile 8 | 1.25 |
| Decile 7 | 1 |
| Decile 6 | 1 |
| Median | 0.75 |
| Decile 4 | 0.5 |
| Decile 3 | 0.5 |
| Decile 2 | 0.5 |
| Decile 1 | 0.25 |
| Minimum | 0 |
|
|
- Mean = 0.908804
- Std.dev = 0.736256
- 1653 items above graph maximum of 3.25
|
2 Instances
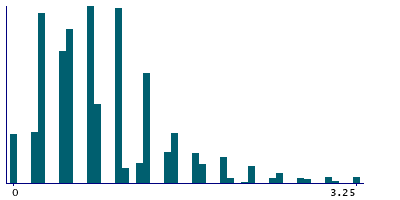
Instance 2 : Imaging visit (2014+)
3,211 participants, 31,560 items
| Maximum | 11.75 |
| Decile 9 | 1.75 |
| Decile 8 | 1.25 |
| Decile 7 | 1 |
| Decile 6 | 1 |
| Median | 0.75 |
| Decile 4 | 0.5 |
| Decile 3 | 0.5 |
| Decile 2 | 0.5 |
| Decile 1 | 0.25 |
| Minimum | 0 |
|
|
- Mean = 0.901149
- Std.dev = 0.728688
- 382 items above graph maximum of 3.25
|
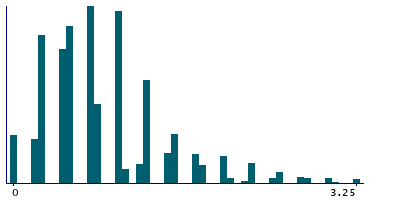
Instance 3 : First repeat imaging visit (2019+)
10,422 participants, 102,854 items
| Maximum | 12 |
| Decile 9 | 1.75 |
| Decile 8 | 1.25 |
| Decile 7 | 1 |
| Decile 6 | 1 |
| Median | 0.75 |
| Decile 4 | 0.5 |
| Decile 3 | 0.5 |
| Decile 2 | 0.5 |
| Decile 1 | 0.25 |
| Minimum | 0 |
|
|
- Mean = 0.911153
- Std.dev = 0.738546
- 1271 items above graph maximum of 3.25
|
Notes
Keratometry spherical value (right)
0 Related Data-Fields
There are no related data-fields
0 Resources
There are no matching Resources
