Data
3,259,289 items of data are available, covering 88,265 participants.
Defined-instances run from 2 to 3, labelled using Instancing
2.
Array indices run from 0 to 135.
Units of measurement are deciseconds.
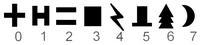
| Maximum | 15977 |
| Decile 9 | 48 |
| Decile 8 | 36 |
| Decile 7 | 31 |
| Decile 6 | 27 |
| Median | 25 |
| Decile 4 | 22 |
| Decile 3 | 21 |
| Decile 2 | 19 |
| Decile 1 | 16 |
| Minimum | 0 |
|
|
- There are 789 distinct values.
- Mean = 30.4303
- Std.dev = 25.8088
- 95015 items above graph maximum of 80
|
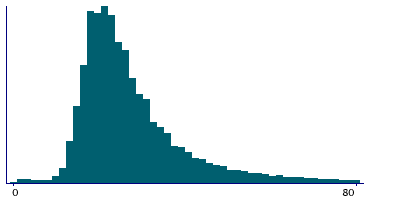
2 Instances
Instance 2 : Imaging visit (2014+)
81,763 participants, 2,619,919 items
| Maximum | 15977 |
| Decile 9 | 48 |
| Decile 8 | 36 |
| Decile 7 | 31 |
| Decile 6 | 27 |
| Median | 25 |
| Decile 4 | 22 |
| Decile 3 | 21 |
| Decile 2 | 19 |
| Decile 1 | 16 |
| Minimum | 0 |
|
|
- There are 750 distinct values.
- Mean = 30.5322
- Std.dev = 26.4558
- 77570 items above graph maximum of 80
|
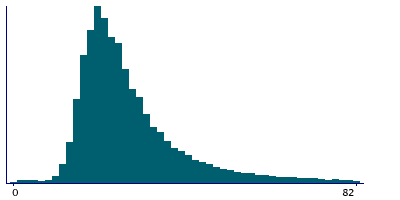
Instance 3 : First repeat imaging visit (2019+)
19,799 participants, 639,370 items
| Maximum | 1328 |
| Decile 9 | 47 |
| Decile 8 | 36 |
| Decile 7 | 30 |
| Decile 6 | 27 |
| Median | 24 |
| Decile 4 | 22 |
| Decile 3 | 20 |
| Decile 2 | 19 |
| Decile 1 | 16 |
| Minimum | 0 |
|
|
- There are 507 distinct values.
- Mean = 30.0126
- Std.dev = 22.9632
- 18574 items above graph maximum of 78
|