Data
5,721,256 items of data are available, covering 94,741 participants.
Defined-instances run from 0 to 1, labelled using Instancing
2.
Array indices run from 0 to 111.
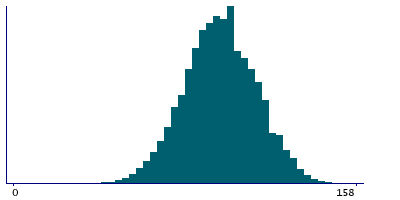
| Maximum | 300 |
| Decile 9 | 116 |
| Decile 8 | 109 |
| Decile 7 | 104 |
| Decile 6 | 100 |
| Median | 95 |
| Decile 4 | 91 |
| Decile 3 | 86 |
| Decile 2 | 81 |
| Decile 1 | 74 |
| Minimum | 30 |
|
|
- There are 150 distinct values.
- Mean = 95.1501
- Std.dev = 16.57
- 1252 items above graph maximum of 158
|
2 Instances
Instance 0 : Initial assessment visit (2006-2010) at which participants were recruited and consent given
77,562 participants, 4,545,822 items
| Maximum | 300 |
| Decile 9 | 117 |
| Decile 8 | 110 |
| Decile 7 | 104 |
| Decile 6 | 100 |
| Median | 96 |
| Decile 4 | 91 |
| Decile 3 | 87 |
| Decile 2 | 82 |
| Decile 1 | 75 |
| Minimum | 30 |
|

|
- There are 150 distinct values.
- Mean = 95.6413
- Std.dev = 16.5763
- 877 items above graph maximum of 159
|
Instance 1 : First repeat assessment visit (2012-13)
20,061 participants, 1,175,434 items
| Maximum | 300 |
| Decile 9 | 115 |
| Decile 8 | 107 |
| Decile 7 | 101 |
| Decile 6 | 97 |
| Median | 93 |
| Decile 4 | 89 |
| Decile 3 | 85 |
| Decile 2 | 80 |
| Decile 1 | 72 |
| Minimum | 30 |
|

|
- There are 150 distinct values.
- Mean = 93.2503
- Std.dev = 16.4076
- 375 items above graph maximum of 158
|
Notes
ECG, heart rate
The Bike Test consists of many phases. A phase is generally divided into number of stages. At various points during the test, called trends, readings about heart rate, workload etc are recorded. This field contains heart rate (beats per minute) at the time of the trend entry
0 Related Data-Fields
There are no related data-fields
1 Application
| Application ID | Title |
|---|
| 15031 | Genetic dissection of cardiovascular risk factors and their relation to disease to establish causality and identify novel targets of therapy |


