Data
32,763 items of data are available, covering 28,653 participants.
Defined-instances run from 0 to 3, labelled using Instancing
2.
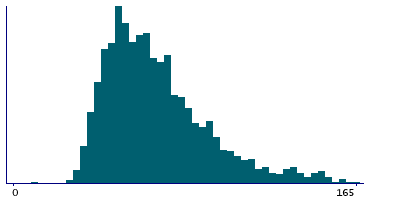
| Maximum | 900 |
| Decile 9 | 107 |
| Decile 8 | 88 |
| Decile 7 | 78 |
| Decile 6 | 70 |
| Median | 64 |
| Decile 4 | 58 |
| Decile 3 | 53 |
| Decile 2 | 48 |
| Decile 1 | 42 |
| Minimum | 3 |
|
|
- There are 266 distinct values.
- Mean = 70.0895
- Std.dev = 29.3908
- 272 items above graph maximum of 172
|
4 Instances
Instance 0 : Initial assessment visit (2006-2010) at which participants were recruited and consent given
16,718 participants, 16,718 items
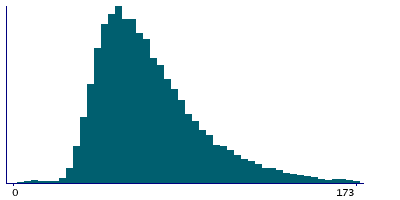
| Maximum | 900 |
| Decile 9 | 109 |
| Decile 8 | 90 |
| Decile 7 | 79 |
| Decile 6 | 71 |
| Median | 64 |
| Decile 4 | 58 |
| Decile 3 | 52 |
| Decile 2 | 47 |
| Decile 1 | 41 |
| Minimum | 3 |
|
|
- There are 255 distinct values.
- Mean = 70.6497
- Std.dev = 31.6361
- 159 items above graph maximum of 177
|
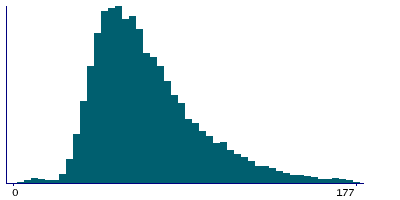
Instance 1 : First repeat assessment visit (2012-13)
2,325 participants, 2,325 items
| Maximum | 324 |
| Decile 9 | 107 |
| Decile 8 | 88 |
| Decile 7 | 78 |
| Decile 6 | 70 |
| Median | 64 |
| Decile 4 | 58 |
| Decile 3 | 53 |
| Decile 2 | 48 |
| Decile 1 | 42 |
| Minimum | 8 |
|
|
- There are 146 distinct values.
- Mean = 69.8697
- Std.dev = 27.4494
- 14 items above graph maximum of 172
|
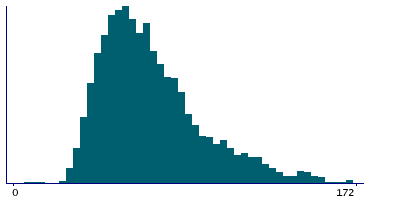
Instance 2 : Imaging visit (2014+)
11,168 participants, 11,168 items
| Maximum | 420 |
| Decile 9 | 103 |
| Decile 8 | 87 |
| Decile 7 | 77 |
| Decile 6 | 70 |
| Median | 64 |
| Decile 4 | 58 |
| Decile 3 | 53 |
| Decile 2 | 48 |
| Decile 1 | 42 |
| Minimum | 3 |
|
|
- There are 202 distinct values.
- Mean = 69.3497
- Std.dev = 26.9678
- 91 items above graph maximum of 164
|
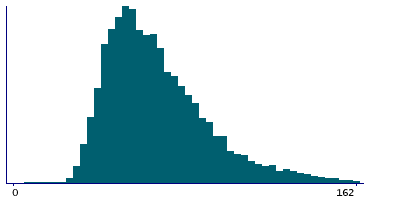
Instance 3 : First repeat imaging visit (2019+)
2,552 participants, 2,552 items
| Maximum | 239 |
| Decile 9 | 102 |
| Decile 8 | 87 |
| Decile 7 | 77.5 |
| Decile 6 | 71 |
| Median | 65 |
| Decile 4 | 60 |
| Decile 3 | 54 |
| Decile 2 | 49 |
| Decile 1 | 43 |
| Minimum | 7 |
|
|
- There are 149 distinct values.
- Mean = 69.857
- Std.dev = 25.6852
- 18 items above graph maximum of 161
|

