Data
642,745 items of data are available, covering 500,788 participants.
Defined-instances run from 0 to 3, labelled using Instancing
2.
Units of measurement are seconds.
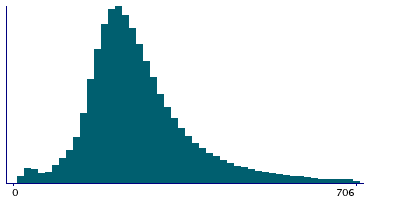
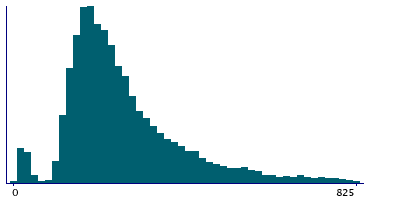
| Maximum | 5264 |
| Decile 9 | 429 |
| Decile 8 | 340 |
| Decile 7 | 295 |
| Decile 6 | 265 |
| Median | 242 |
| Decile 4 | 221 |
| Decile 3 | 201 |
| Decile 2 | 180 |
| Decile 1 | 150 |
| Minimum | 6 |
|
|
- There are 1938 distinct values.
- Mean = 275.35
- Std.dev = 156.689
- 14599 items above graph maximum of 708
|
4 Instances
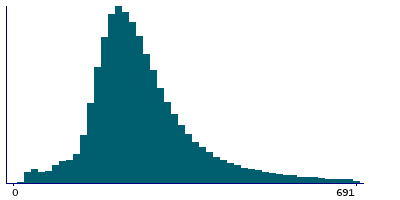
Instance 0 : Initial assessment visit (2006-2010) at which participants were recruited and consent given
500,725 participants, 500,725 items
| Maximum | 4341 |
| Decile 9 | 424 |
| Decile 8 | 336 |
| Decile 7 | 294 |
| Decile 6 | 265 |
| Median | 243 |
| Decile 4 | 223 |
| Decile 3 | 204 |
| Decile 2 | 185 |
| Decile 1 | 157 |
| Minimum | 14 |
|
|
- There are 1903 distinct values.
- Mean = 276.851
- Std.dev = 156.914
- 12472 items above graph maximum of 691
|
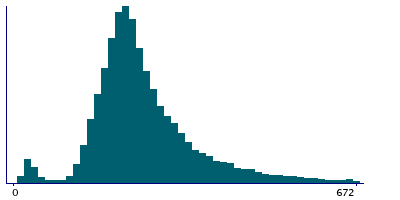
Instance 1 : First repeat assessment visit (2012-13)
20,314 participants, 20,314 items
| Maximum | 2016 |
| Decile 9 | 416 |
| Decile 8 | 328 |
| Decile 7 | 284 |
| Decile 6 | 256 |
| Median | 236 |
| Decile 4 | 220 |
| Decile 3 | 204 |
| Decile 2 | 186 |
| Decile 1 | 160 |
| Minimum | 15 |
|
|
- There are 969 distinct values.
- Mean = 270.989
- Std.dev = 146.885
- 506 items above graph maximum of 672
|
Instance 2 : Imaging visit (2014+)
100,744 participants, 100,744 items
| Maximum | 5264 |
| Decile 9 | 445 |
| Decile 8 | 356 |
| Decile 7 | 305 |
| Decile 6 | 268 |
| Median | 236 |
| Decile 4 | 208 |
| Decile 3 | 181 |
| Decile 2 | 157 |
| Decile 1 | 129 |
| Minimum | 7 |
|
|
- There are 1282 distinct values.
- Mean = 268.937
- Std.dev = 157.894
- 1604 items above graph maximum of 761
|
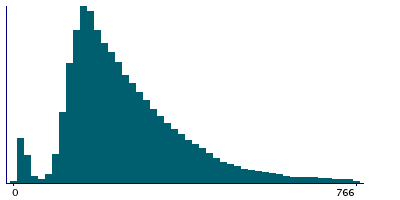
Instance 3 : First repeat imaging visit (2019+)
20,962 participants, 20,962 items
| Maximum | 2319 |
| Decile 9 | 451 |
| Decile 8 | 354 |
| Decile 7 | 301 |
| Decile 6 | 267 |
| Median | 240 |
| Decile 4 | 216 |
| Decile 3 | 194 |
| Decile 2 | 171 |
| Decile 1 | 144 |
| Minimum | 6 |
|
|
- There are 974 distinct values.
- Mean = 274.554
- Std.dev = 153.805
- 374 items above graph maximum of 758
|
Notes
Time taken for participant to complete the blood phlebotomy station of the Assessment Centre visit. This is longer than the time during which they were actively giving blood.
0 Related Data-Fields
There are no related data-fields
0 Resources
There are no matching Resources
