Data
9,226 items of data are available, covering 4,613 participants.
Defined-instances run from 2 to 3, labelled using Instancing
2.
Units of measurement are AU.
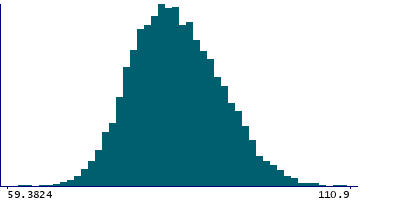
| Maximum | 119 |
| Decile 9 | 93.7275 |
| Decile 8 | 90.5145 |
| Decile 7 | 88.1465 |
| Decile 6 | 86.1894 |
| Median | 84.3649 |
| Decile 4 | 82.6523 |
| Decile 3 | 80.8837 |
| Decile 2 | 78.9403 |
| Decile 1 | 76.5549 |
| Minimum | 0 |
|
|
- Mean = 84.7107
- Std.dev = 6.9702
- 7 items below graph minimum of 59.3824
- 3 items above graph maximum of 110.9
|
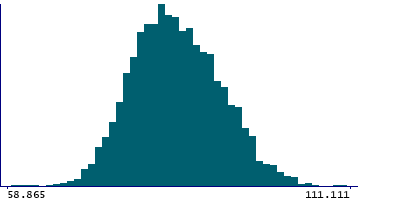
2 Instances
Instance 2 : Imaging visit (2014+)
4,613 participants, 4,613 items
| Maximum | 115.673 |
| Decile 9 | 93.6954 |
| Decile 8 | 90.4581 |
| Decile 7 | 88.1165 |
| Decile 6 | 86.126 |
| Median | 84.2236 |
| Decile 4 | 82.4778 |
| Decile 3 | 80.6751 |
| Decile 2 | 78.8207 |
| Decile 1 | 76.2802 |
| Minimum | 0 |
|
|
- Mean = 84.5656
- Std.dev = 7.02299
- 5 items below graph minimum of 58.865
- 1 item above graph maximum of 111.111
|
Instance 3 : First repeat imaging visit (2019+)
4,613 participants, 4,613 items
| Maximum | 119 |
| Decile 9 | 93.7876 |
| Decile 8 | 90.5674 |
| Decile 7 | 88.1661 |
| Decile 6 | 86.2562 |
| Median | 84.4877 |
| Decile 4 | 82.8251 |
| Decile 3 | 81.0472 |
| Decile 2 | 79.0888 |
| Decile 1 | 76.7332 |
| Minimum | 0 |
|

|
- Mean = 84.8557
- Std.dev = 6.91397
- 2 items below graph minimum of 59.6788
- 2 items above graph maximum of 110.842
|
Notes
Mean intensity of the optic chiasm in the whole brain generated by subcortical volumetric segmentation (aseg) with the longitudinal processing option in FreeSurfer.
0 Related Data-Fields
There are no related data-fields
0 Resources
There are no matching Resources
