Data
483,712 items of data are available, covering 483,712 participants.
Defined-instances run from 0 to 2, labelled using Instancing
2.
Units of measurement are %.
| Maximum | 5.01 |
| Decile 9 | 0.29 |
| Decile 8 | 0.215 |
| Decile 7 | 0.15 |
| Decile 6 | 0.11 |
| Median | 0.074 |
| Decile 4 | 0.056 |
| Decile 3 | 0.04 |
| Decile 2 | 0.026 |
| Decile 1 | 0.017 |
| Minimum | 0 |
|
|
- Mean = 0.12318
- Std.dev = 0.130634
- 5069 items above graph maximum of 0.563
|
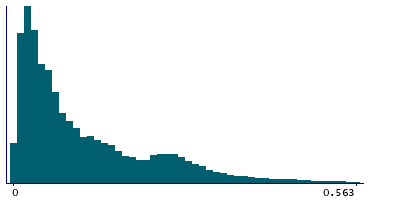
3 Instances
Instance 0 : Initial assessment visit (2006-2010) at which participants were recruited and consent given
482,311 participants, 482,311 items
| Maximum | 5.01 |
| Decile 9 | 0.29 |
| Decile 8 | 0.215 |
| Decile 7 | 0.15 |
| Decile 6 | 0.11 |
| Median | 0.075 |
| Decile 4 | 0.056 |
| Decile 3 | 0.04 |
| Decile 2 | 0.026 |
| Decile 1 | 0.017 |
| Minimum | 0 |
|

|
- Mean = 0.123205
- Std.dev = 0.130629
- 5054 items above graph maximum of 0.563
|
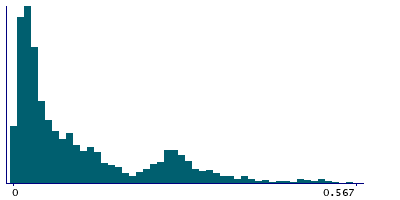
Instance 1 : First repeat assessment visit (2012-13)
1,346 participants, 1,346 items
| Maximum | 1.37 |
| Decile 9 | 0.29 |
| Decile 8 | 0.23 |
| Decile 7 | 0.13 |
| Decile 6 | 0.09 |
| Median | 0.06 |
| Decile 4 | 0.04 |
| Decile 3 | 0.03 |
| Decile 2 | 0.021 |
| Decile 1 | 0.013 |
| Minimum | 0 |
|
|
- Mean = 0.115745
- Std.dev = 0.133096
- 15 items above graph maximum of 0.567
|
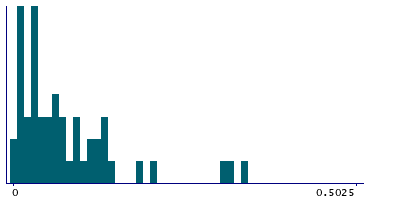
Instance 2 : Imaging visit (2014+)
55 participants, 55 items
| Maximum | 0.52 |
| Decile 9 | 0.257 |
| Decile 8 | 0.13 |
| Decile 7 | 0.095 |
| Decile 6 | 0.07 |
| Median | 0.0585 |
| Decile 4 | 0.043 |
| Decile 3 | 0.03 |
| Decile 2 | 0.017 |
| Decile 1 | 0.0115 |
| Minimum | 0 |
|
|
- Mean = 0.088
- Std.dev = 0.100397
- 1 item above graph maximum of 0.5025
|
Notes
Sample discordance levels at non-reference genotypes.
0 Related Data-Fields
There are no related data-fields
0 Resources
There are no matching Resources
