Data
12,175 items of data are available, covering 11,942 participants.
Defined-instances run from 0 to 3, labelled using Instancing
2.
Units of measurement are Kg.
| Maximum | 196 |
| Decile 9 | 100 |
| Decile 8 | 91 |
| Decile 7 | 85 |
| Decile 6 | 80.2 |
| Median | 76 |
| Decile 4 | 72 |
| Decile 3 | 68 |
| Decile 2 | 63.8 |
| Decile 1 | 58 |
| Minimum | 30 |
|
|
- Mean = 78.3265
- Std.dev = 17.9494
- 71 items above graph maximum of 142
|
4 Instances
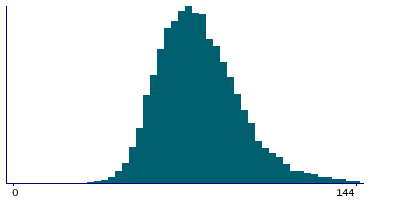
Instance 0 : Initial assessment visit (2006-2010) at which participants were recruited and consent given
7,343 participants, 7,343 items
| Maximum | 196 |
| Decile 9 | 103 |
| Decile 8 | 93 |
| Decile 7 | 87 |
| Decile 6 | 82 |
| Median | 77 |
| Decile 4 | 73 |
| Decile 3 | 69 |
| Decile 2 | 64 |
| Decile 1 | 58.65 |
| Minimum | 30 |
|
|
- Mean = 79.5028
- Std.dev = 18.7195
- 47 items above graph maximum of 147.35
|
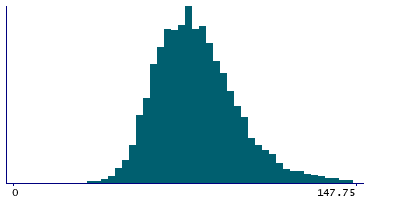
Instance 1 : First repeat assessment visit (2012-13)
259 participants, 259 items
| Maximum | 155 |
| Decile 9 | 103 |
| Decile 8 | 94 |
| Decile 7 | 88 |
| Decile 6 | 83.5 |
| Median | 79 |
| Decile 4 | 74.15 |
| Decile 3 | 71 |
| Decile 2 | 66 |
| Decile 1 | 61.5 |
| Minimum | 41 |
|
|
- Mean = 80.8745
- Std.dev = 17.2376
- 1 item above graph maximum of 144.5
|
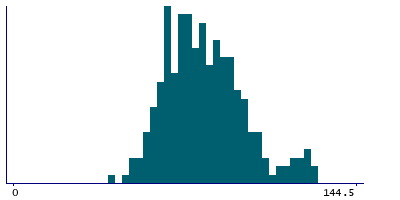
Instance 2 : Imaging visit (2014+)
3,736 participants, 3,736 items
| Maximum | 187 |
| Decile 9 | 97.4 |
| Decile 8 | 89.1 |
| Decile 7 | 83.5 |
| Decile 6 | 78.5 |
| Median | 74.6 |
| Decile 4 | 70.7 |
| Decile 3 | 67 |
| Decile 2 | 62 |
| Decile 1 | 57 |
| Minimum | 33 |
|
|
- Mean = 76.3481
- Std.dev = 16.7064
- 12 items above graph maximum of 137.8
|
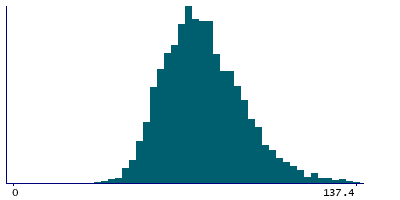
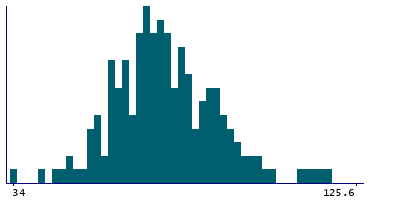
Instance 3 : First repeat imaging visit (2019+)
837 participants, 837 items
| Maximum | 146 |
| Decile 9 | 95.55 |
| Decile 8 | 87.2 |
| Decile 7 | 82.3 |
| Decile 6 | 79 |
| Median | 75 |
| Decile 4 | 71.6 |
| Decile 3 | 68.1 |
| Decile 2 | 63.2 |
| Decile 1 | 57.4 |
| Minimum | 34 |
|
|
- Mean = 76.05
- Std.dev = 15.4157
- 3 items above graph maximum of 133.7
|

