Data
82,781 items of data are available, covering 82,781 participants.
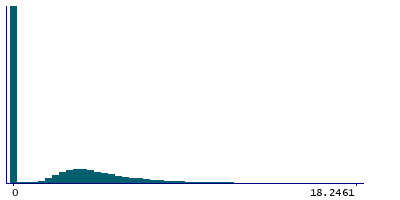
Defined-instances run from 0 to 1, labelled using Instancing
2.
| Maximum | 627.795 |
| Decile 9 | 9.12012 |
| Decile 8 | 5.52734 |
| Decile 7 | 4.17578 |
| Decile 6 | 3.18164 |
| Median | 1.64453 |
| Decile 4 | 0 |
| Decile 3 | 0 |
| Decile 2 | 0 |
| Decile 1 | 0 |
| Minimum | 0 |
|
|
- Mean = 12.0341
- Std.dev = 54.9822
- 5698 items above graph maximum of 18.2402
|
2 Instances
Instance 0 : Initial assessment visit (2006-2010) at which participants were recruited and consent given
67,219 participants, 67,219 items
| Maximum | 623.986 |
| Decile 9 | 7.85547 |
| Decile 8 | 5.09766 |
| Decile 7 | 3.87695 |
| Decile 6 | 2.87305 |
| Median | 0 |
| Decile 4 | 0 |
| Decile 3 | 0 |
| Decile 2 | 0 |
| Decile 1 | 0 |
| Minimum | 0 |
|

|
- Mean = 10.5361
- Std.dev = 51.7573
- 4007 items above graph maximum of 15.7109
|
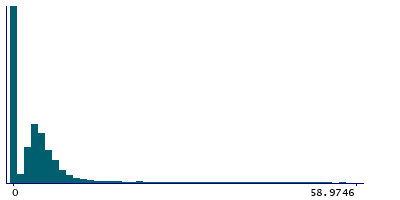
Instance 1 : First repeat assessment visit (2012-13)
15,562 participants, 15,562 items
| Maximum | 627.795 |
| Decile 9 | 29.375 |
| Decile 8 | 7.87598 |
| Decile 7 | 5.66992 |
| Decile 6 | 4.43555 |
| Median | 3.45117 |
| Decile 4 | 2.29004 |
| Decile 3 | 0 |
| Decile 2 | 0 |
| Decile 1 | 0 |
| Minimum | 0 |
|
|
- Mean = 18.505
- Std.dev = 66.7705
- 975 items above graph maximum of 58.75
|
Notes
This field should be used to quality control the values generated by the Topcon Advanced Boundary Segmentation [TABS] software in
Category 100079. Information about how the research group who generated the values quality controlled them for their publication can be seen in
Return 1875.
0 Related Data-Fields
There are no related data-fields
0 Resources
There are no matching Resources
