Data
82,772 items of data are available, covering 82,772 participants.
Defined-instances run from 0 to 1, labelled using Instancing
2.
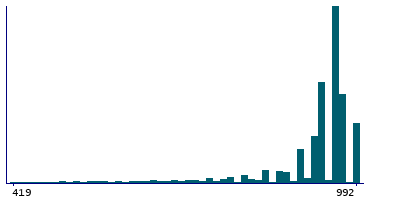
| Maximum | 992 |
| Decile 9 | 961 |
| Decile 8 | 961 |
| Decile 7 | 961 |
| Decile 6 | 961 |
| Median | 930 |
| Decile 4 | 930 |
| Decile 3 | 930 |
| Decile 2 | 868 |
| Decile 1 | 690 |
| Minimum | 0 |
|
|
- There are 976 distinct values.
- Mean = 878.147
- Std.dev = 184.24
- 3648 items below graph minimum of 419
|
2 Instances
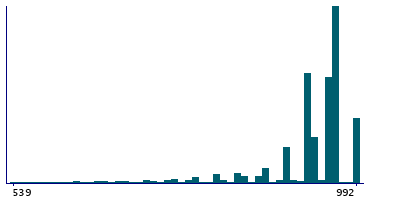
Instance 0 : Initial assessment visit (2006-2010) at which participants were recruited and consent given
67,222 participants, 67,222 items
| Maximum | 992 |
| Decile 9 | 961 |
| Decile 8 | 961 |
| Decile 7 | 961 |
| Decile 6 | 961 |
| Median | 959 |
| Decile 4 | 930 |
| Decile 3 | 930 |
| Decile 2 | 886 |
| Decile 1 | 750 |
| Minimum | 0 |
|
|
- There are 939 distinct values.
- Mean = 891.625
- Std.dev = 161.232
- 3374 items below graph minimum of 539
|
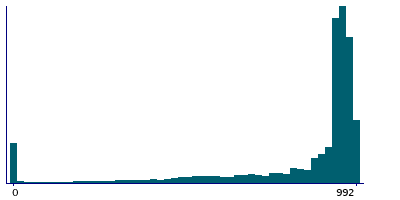
Instance 1 : First repeat assessment visit (2012-13)
15,550 participants, 15,550 items
| Maximum | 992 |
| Decile 9 | 961 |
| Decile 8 | 961 |
| Decile 7 | 961 |
| Decile 6 | 960 |
| Median | 930 |
| Decile 4 | 930 |
| Decile 3 | 868 |
| Decile 2 | 720 |
| Decile 1 | 460 |
| Minimum | 0 |
|
|
- There are 852 distinct values.
- Mean = 819.882
- Std.dev = 253.23
|
Notes
This field should be used to quality control the values generated by the Topcon Advanced Boundary Segmentation [TABS] software in
Category 100079. Information about how the research group who generated the values quality controlled them for their publication can be seen in
Return 1875.
0 Related Data-Fields
There are no related data-fields
0 Resources
There are no matching Resources
