Data
82,781 items of data are available, covering 82,781 participants.
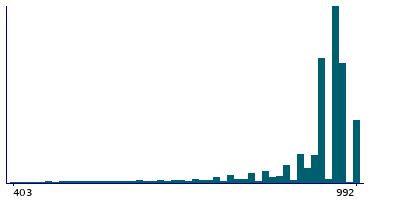
Defined-instances run from 0 to 1, labelled using Instancing
2.
| Maximum | 992 |
| Decile 9 | 961 |
| Decile 8 | 961 |
| Decile 7 | 961 |
| Decile 6 | 961 |
| Median | 942 |
| Decile 4 | 930 |
| Decile 3 | 929 |
| Decile 2 | 868 |
| Decile 1 | 682 |
| Minimum | 0 |
|
|
- There are 974 distinct values.
- Mean = 877.005
- Std.dev = 183.846
- 3481 items below graph minimum of 403
|
2 Instances
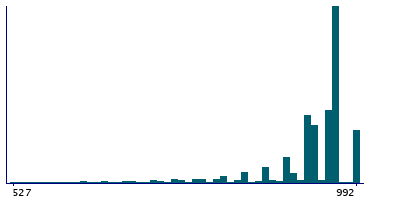
Instance 0 : Initial assessment visit (2006-2010) at which participants were recruited and consent given
67,219 participants, 67,219 items
| Maximum | 992 |
| Decile 9 | 961 |
| Decile 8 | 961 |
| Decile 7 | 961 |
| Decile 6 | 961 |
| Median | 957 |
| Decile 4 | 930 |
| Decile 3 | 930 |
| Decile 2 | 870 |
| Decile 1 | 744 |
| Minimum | 0 |
|
|
- There are 951 distinct values.
- Mean = 889.008
- Std.dev = 162.221
- 3373 items below graph minimum of 527
|
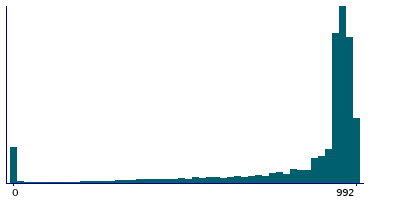
Instance 1 : First repeat assessment visit (2012-13)
15,562 participants, 15,562 items
| Maximum | 992 |
| Decile 9 | 961 |
| Decile 8 | 961 |
| Decile 7 | 961 |
| Decile 6 | 961 |
| Median | 930 |
| Decile 4 | 930 |
| Decile 3 | 870 |
| Decile 2 | 744 |
| Decile 1 | 448.5 |
| Minimum | 0 |
|
|
- There are 829 distinct values.
- Mean = 825.16
- Std.dev = 250.627
|
Notes
This field should be used to quality control the values generated by the Topcon Advanced Boundary Segmentation [TABS] software in
Category 100079. Information about how the research group who generated the values quality controlled them for their publication can be seen in
Return 1875.
0 Related Data-Fields
There are no related data-fields
0 Resources
There are no matching Resources
