Data
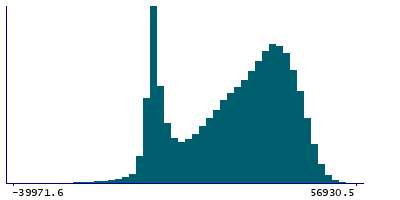
82,781 items of data are available, covering 82,781 participants.
Defined-instances run from 0 to 1, labelled using Instancing
2.
| Maximum | 56930.5 |
| Decile 9 | 39971.4 |
| Decile 8 | 36198 |
| Decile 7 | 32866.5 |
| Decile 6 | 29334.2 |
| Median | 25225.8 |
| Decile 4 | 20316.6 |
| Decile 3 | 14022 |
| Decile 2 | 4110.62 |
| Decile 1 | 0 |
| Minimum | -56921.5 |
|
|
- Mean = 22180.6
- Std.dev = 15034
- 14 items below graph minimum of -39971.4
- 1 item above graph maximum of 56930.5
|
2 Instances
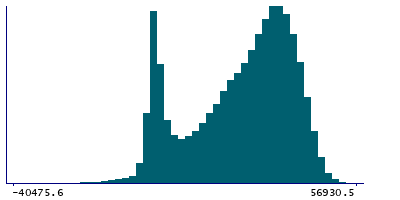
Instance 0 : Initial assessment visit (2006-2010) at which participants were recruited and consent given
67,219 participants, 67,219 items
| Maximum | 56930.5 |
| Decile 9 | 40475.6 |
| Decile 8 | 36956.1 |
| Decile 7 | 33891.2 |
| Decile 6 | 30779.5 |
| Median | 27136.2 |
| Decile 4 | 22574 |
| Decile 3 | 16862.1 |
| Decile 2 | 7368.43 |
| Decile 1 | 0 |
| Minimum | -56921.5 |
|
|
- Mean = 23676.1
- Std.dev = 14663.1
- 4 items below graph minimum of -40475.6
- 1 item above graph maximum of 56930.5
|
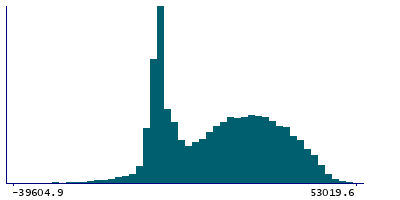
Instance 1 : First repeat assessment visit (2012-13)
15,562 participants, 15,562 items
| Maximum | 53019.6 |
| Decile 9 | 35907.9 |
| Decile 8 | 30423.1 |
| Decile 7 | 25654.5 |
| Decile 6 | 20975.9 |
| Median | 16158.6 |
| Decile 4 | 9910.32 |
| Decile 3 | 3074.02 |
| Decile 2 | 0 |
| Decile 1 | -1841.63 |
| Minimum | -51459.1 |
|
|
- Mean = 15720.5
- Std.dev = 14906.7
- 10 items below graph minimum of -39591.2
- 1 item above graph maximum of 53019.6
|
Notes
This field should be used to quality control the values generated by the Topcon Advanced Boundary Segmentation [TABS] software in
Category 100079. Information about how the research group who generated the values quality controlled them for their publication can be seen in
Return 1875.
0 Related Data-Fields
There are no related data-fields
0 Resources
There are no matching Resources
