Data
87,996 items of data are available, covering 83,313 participants.
Defined-instances run from 2 to 3, labelled using Instancing
2.
Units of measurement are mm.
| Maximum | 4.094 |
| Decile 9 | 3.474 |
| Decile 8 | 3.388 |
| Decile 7 | 3.324 |
| Decile 6 | 3.268 |
| Median | 3.216 |
| Decile 4 | 3.163 |
| Decile 3 | 3.104 |
| Decile 2 | 3.034 |
| Decile 1 | 2.931 |
| Minimum | 1.421 |
|
|
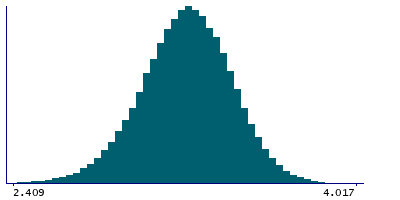
- Mean = 3.20798
- Std.dev = 0.215476
- 81 items below graph minimum of 2.388
- 5 items above graph maximum of 4.017
|
2 Instances
Instance 2 : Imaging visit (2014+)
83,241 participants, 83,241 items
| Maximum | 4.094 |
| Decile 9 | 3.474 |
| Decile 8 | 3.387 |
| Decile 7 | 3.323 |
| Decile 6 | 3.267 |
| Median | 3.215 |
| Decile 4 | 3.161 |
| Decile 3 | 3.103 |
| Decile 2 | 3.033 |
| Decile 1 | 2.93 |
| Minimum | 1.559 |
|

|
- Mean = 3.20698
- Std.dev = 0.215889
- 78 items below graph minimum of 2.386
- 3 items above graph maximum of 4.018
|
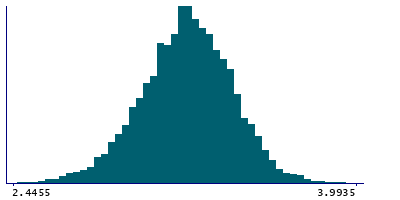
Instance 3 : First repeat imaging visit (2019+)
4,755 participants, 4,755 items
| Maximum | 4.028 |
| Decile 9 | 3.4775 |
| Decile 8 | 3.398 |
| Decile 7 | 3.336 |
| Decile 6 | 3.28 |
| Median | 3.2325 |
| Decile 4 | 3.186 |
| Decile 3 | 3.127 |
| Decile 2 | 3.057 |
| Decile 1 | 2.9615 |
| Minimum | 1.421 |
|
|
- Mean = 3.22552
- Std.dev = 0.207334
- 3 items below graph minimum of 2.4455
- 2 items above graph maximum of 3.9935
|
Notes
Mean thickness of G-temp-sup-Lateral in the right hemisphere generated by parcellation of the white surface using Destrieux (a2009s) parcellation
0 Related Data-Fields
There are no related data-fields
0 Resources
There are no matching Resources
