Data
87,996 items of data are available, covering 83,313 participants.
Defined-instances run from 2 to 3, labelled using Instancing
2.
Units of measurement are mm.
| Maximum | 4.066 |
| Decile 9 | 2.923 |
| Decile 8 | 2.81 |
| Decile 7 | 2.728 |
| Decile 6 | 2.657 |
| Median | 2.589 |
| Decile 4 | 2.521 |
| Decile 3 | 2.448 |
| Decile 2 | 2.361 |
| Decile 1 | 2.239 |
| Minimum | 1.019 |
|
|
- Mean = 2.58481
- Std.dev = 0.267721
- 10 items below graph minimum of 1.555
- 6 items above graph maximum of 3.607
|
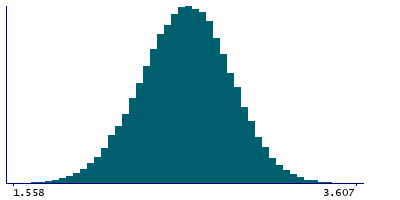
2 Instances
Instance 2 : Imaging visit (2014+)
83,241 participants, 83,241 items
| Maximum | 4.066 |
| Decile 9 | 2.923 |
| Decile 8 | 2.81 |
| Decile 7 | 2.728 |
| Decile 6 | 2.656 |
| Median | 2.589 |
| Decile 4 | 2.521 |
| Decile 3 | 2.447 |
| Decile 2 | 2.36 |
| Decile 1 | 2.239 |
| Minimum | 1.019 |
|

|
- Mean = 2.58446
- Std.dev = 0.267951
- 10 items below graph minimum of 1.555
- 4 items above graph maximum of 3.607
|
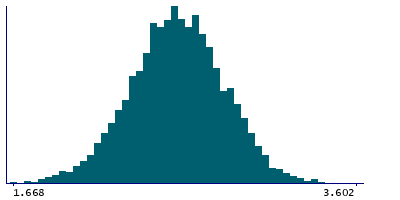
Instance 3 : First repeat imaging visit (2019+)
4,755 participants, 4,755 items
| Maximum | 3.763 |
| Decile 9 | 2.926 |
| Decile 8 | 2.813 |
| Decile 7 | 2.729 |
| Decile 6 | 2.661 |
| Median | 2.592 |
| Decile 4 | 2.528 |
| Decile 3 | 2.457 |
| Decile 2 | 2.372 |
| Decile 1 | 2.25 |
| Minimum | 1.668 |
|
|
- Mean = 2.59101
- Std.dev = 0.263588
- 2 items above graph maximum of 3.602
|
Notes
Mean thickness of transversetemporal in the right hemisphere generated by parcellation of the white surface using DKT parcellation
0 Related Data-Fields
There are no related data-fields
0 Resources
There are no matching Resources
