Data
87,996 items of data are available, covering 83,313 participants.
Defined-instances run from 2 to 3, labelled using Instancing
2.
Units of measurement are mm.
| Maximum | 3.237 |
| Decile 9 | 2.791 |
| Decile 8 | 2.726 |
| Decile 7 | 2.681 |
| Decile 6 | 2.641 |
| Median | 2.605 |
| Decile 4 | 2.568 |
| Decile 3 | 2.528 |
| Decile 2 | 2.481 |
| Decile 1 | 2.414 |
| Minimum | 1.368 |
|

|
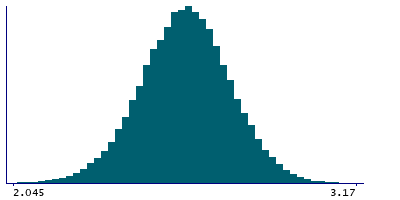
- Mean = 2.60281
- Std.dev = 0.148891
- 39 items below graph minimum of 2.037
- 4 items above graph maximum of 3.168
|
2 Instances
Instance 2 : Imaging visit (2014+)
83,241 participants, 83,241 items
| Maximum | 3.237 |
| Decile 9 | 2.791 |
| Decile 8 | 2.726 |
| Decile 7 | 2.68 |
| Decile 6 | 2.641 |
| Median | 2.604 |
| Decile 4 | 2.567 |
| Decile 3 | 2.527 |
| Decile 2 | 2.48 |
| Decile 1 | 2.413 |
| Minimum | 1.471 |
|
|
- Mean = 2.60229
- Std.dev = 0.149133
- 35 items below graph minimum of 2.035
- 4 items above graph maximum of 3.169
|
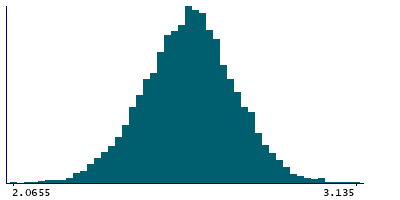
Instance 3 : First repeat imaging visit (2019+)
4,755 participants, 4,755 items
| Maximum | 3.135 |
| Decile 9 | 2.7945 |
| Decile 8 | 2.73 |
| Decile 7 | 2.6855 |
| Decile 6 | 2.649 |
| Median | 2.616 |
| Decile 4 | 2.58 |
| Decile 3 | 2.54 |
| Decile 2 | 2.494 |
| Decile 1 | 2.43 |
| Minimum | 1.368 |
|
|
- Mean = 2.61207
- Std.dev = 0.14428
- 3 items below graph minimum of 2.0655
|
Notes
Mean thickness of MT in the left hemisphere generated by parcellation of the white surface using BA_exvivo parcellation
0 Related Data-Fields
There are no related data-fields
0 Resources
There are no matching Resources
