Data
87,996 items of data are available, covering 83,313 participants.
Defined-instances run from 2 to 3, labelled using Instancing
2.
Units of measurement are AU.
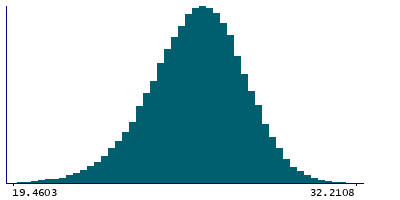
| Maximum | 32.4252 |
| Decile 9 | 28.358 |
| Decile 8 | 27.6397 |
| Decile 7 | 27.1234 |
| Decile 6 | 26.663 |
| Median | 26.2203 |
| Decile 4 | 25.7683 |
| Decile 3 | 25.2597 |
| Decile 2 | 24.6463 |
| Decile 1 | 23.7496 |
| Minimum | 16.3416 |
|
|
- Mean = 26.1204
- Std.dev = 1.82101
- 63 items below graph minimum of 19.1412
|
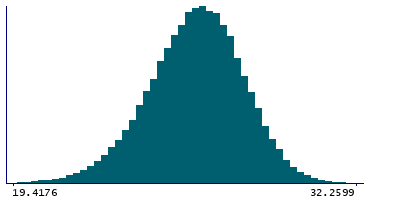
2 Instances
Instance 2 : Imaging visit (2014+)
83,241 participants, 83,241 items
| Maximum | 32.4252 |
| Decile 9 | 28.3601 |
| Decile 8 | 27.6386 |
| Decile 7 | 27.1187 |
| Decile 6 | 26.6539 |
| Median | 26.2097 |
| Decile 4 | 25.7563 |
| Decile 3 | 25.2446 |
| Decile 2 | 24.6315 |
| Decile 1 | 23.736 |
| Minimum | 16.3416 |
|
|
- Mean = 26.1119
- Std.dev = 1.82792
- 60 items below graph minimum of 19.112
|
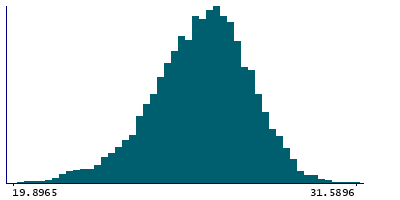
Instance 3 : First repeat imaging visit (2019+)
4,755 participants, 4,755 items
| Maximum | 31.5896 |
| Decile 9 | 28.3119 |
| Decile 8 | 27.6704 |
| Decile 7 | 27.2077 |
| Decile 6 | 26.7843 |
| Median | 26.388 |
| Decile 4 | 25.9805 |
| Decile 3 | 25.4952 |
| Decile 2 | 24.9353 |
| Decile 1 | 24.1042 |
| Minimum | 16.9533 |
|
|
- Mean = 26.2704
- Std.dev = 1.68836
- 4 items below graph minimum of 19.8965
|
Notes
Grey-white contrast in precuneus in the right hemisphere calculated as a percentage of the mean gray-white matter intensity from Desikan-Killiany parcellation
0 Related Data-Fields
There are no related data-fields
0 Resources
There are no matching Resources
