Data
87,996 items of data are available, covering 83,313 participants.
Defined-instances run from 2 to 3, labelled using Instancing
2.
Units of measurement are AU.
| Maximum | 33.1627 |
| Decile 9 | 25.7171 |
| Decile 8 | 24.9055 |
| Decile 7 | 24.327 |
| Decile 6 | 23.8448 |
| Median | 23.3907 |
| Decile 4 | 22.9348 |
| Decile 3 | 22.4425 |
| Decile 2 | 21.8588 |
| Decile 1 | 21.0602 |
| Minimum | 13.9494 |
|

|
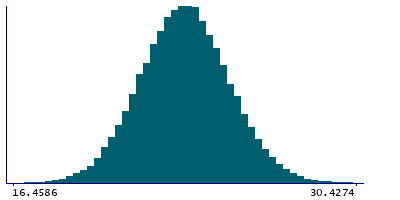
- Mean = 23.3906
- Std.dev = 1.84083
- 17 items below graph minimum of 16.4032
- 43 items above graph maximum of 30.3741
|
2 Instances
Instance 2 : Imaging visit (2014+)
83,241 participants, 83,241 items
| Maximum | 33.1627 |
| Decile 9 | 25.7329 |
| Decile 8 | 24.9166 |
| Decile 7 | 24.3346 |
| Decile 6 | 23.8494 |
| Median | 23.3957 |
| Decile 4 | 22.9378 |
| Decile 3 | 22.4436 |
| Decile 2 | 21.8563 |
| Decile 1 | 21.0564 |
| Minimum | 13.9494 |
|
|
- Mean = 23.3963
- Std.dev = 1.8476
- 16 items below graph minimum of 16.3799
- 42 items above graph maximum of 30.4094
|
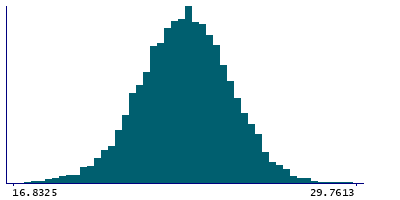
Instance 3 : First repeat imaging visit (2019+)
4,755 participants, 4,755 items
| Maximum | 30.2155 |
| Decile 9 | 25.4517 |
| Decile 8 | 24.7093 |
| Decile 7 | 24.2067 |
| Decile 6 | 23.7305 |
| Median | 23.3252 |
| Decile 4 | 22.8851 |
| Decile 3 | 22.4177 |
| Decile 2 | 21.8925 |
| Decile 1 | 21.1421 |
| Minimum | 14.0998 |
|
|
- Mean = 23.2904
- Std.dev = 1.71482
- 2 items below graph minimum of 16.8325
- 1 item above graph maximum of 29.7613
|
Notes
Grey-white contrast in postcentral in the left hemisphere calculated as a percentage of the mean gray-white matter intensity from Desikan-Killiany parcellation
0 Related Data-Fields
There are no related data-fields
0 Resources
There are no matching Resources
