Data
87,996 items of data are available, covering 83,313 participants.
Defined-instances run from 2 to 3, labelled using Instancing
2.
Units of measurement are mm2.
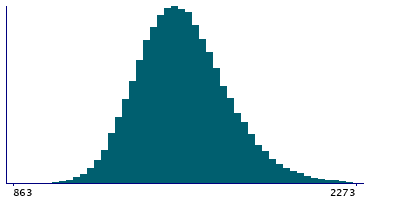
| Maximum | 3786 |
| Decile 9 | 1798 |
| Decile 8 | 1704 |
| Decile 7 | 1641 |
| Decile 6 | 1590 |
| Median | 1543 |
| Decile 4 | 1499 |
| Decile 3 | 1452 |
| Decile 2 | 1400 |
| Decile 1 | 1330 |
| Minimum | 832 |
|
|
- Mean = 1556.47
- Std.dev = 186.373
- 1 item below graph minimum of 862
- 124 items above graph maximum of 2266
|
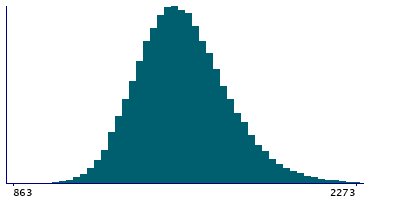
2 Instances
Instance 2 : Imaging visit (2014+)
83,241 participants, 83,241 items
| Maximum | 3786 |
| Decile 9 | 1798 |
| Decile 8 | 1703 |
| Decile 7 | 1640 |
| Decile 6 | 1589 |
| Median | 1543 |
| Decile 4 | 1498 |
| Decile 3 | 1452 |
| Decile 2 | 1399 |
| Decile 1 | 1330 |
| Minimum | 832 |
|
|
- Mean = 1555.91
- Std.dev = 186.525
- 1 item below graph minimum of 862
- 115 items above graph maximum of 2266
|
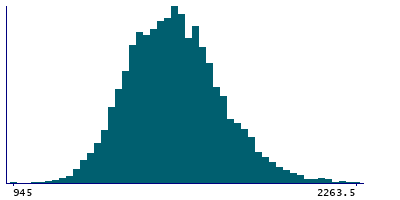
Instance 3 : First repeat imaging visit (2019+)
4,755 participants, 4,755 items
| Maximum | 2517 |
| Decile 9 | 1804 |
| Decile 8 | 1710 |
| Decile 7 | 1652 |
| Decile 6 | 1600 |
| Median | 1557 |
| Decile 4 | 1511 |
| Decile 3 | 1461 |
| Decile 2 | 1410 |
| Decile 1 | 1344.5 |
| Minimum | 945 |
|
|
- Mean = 1566.26
- Std.dev = 183.415
- 9 items above graph maximum of 2263.5
|
Notes
Area of paracentral in the left hemisphere generated by parcellation of the pial surface using Desikan-Killiany parcellation
0 Related Data-Fields
There are no related data-fields
0 Resources
There are no matching Resources
