Data
87,996 items of data are available, covering 83,313 participants.
Defined-instances run from 2 to 3, labelled using Instancing
2.
Units of measurement are mm.
| Maximum | 3.549 |
| Decile 9 | 3.161 |
| Decile 8 | 3.099 |
| Decile 7 | 3.054 |
| Decile 6 | 3.015 |
| Median | 2.98 |
| Decile 4 | 2.942 |
| Decile 3 | 2.903 |
| Decile 2 | 2.854 |
| Decile 1 | 2.785 |
| Minimum | 1.727 |
|

|
- Mean = 2.97559
- Std.dev = 0.148735
- 42 items below graph minimum of 2.409
- 2 items above graph maximum of 3.537
|
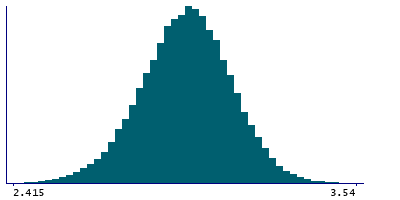
2 Instances
Instance 2 : Imaging visit (2014+)
83,241 participants, 83,241 items
| Maximum | 3.549 |
| Decile 9 | 3.161 |
| Decile 8 | 3.099 |
| Decile 7 | 3.054 |
| Decile 6 | 3.015 |
| Median | 2.979 |
| Decile 4 | 2.942 |
| Decile 3 | 2.902 |
| Decile 2 | 2.854 |
| Decile 1 | 2.784 |
| Minimum | 1.888 |
|
|
- Mean = 2.97513
- Std.dev = 0.148953
- 38 items below graph minimum of 2.407
- 2 items above graph maximum of 3.538
|
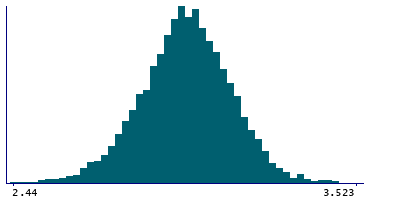
Instance 3 : First repeat imaging visit (2019+)
4,755 participants, 4,755 items
| Maximum | 3.535 |
| Decile 9 | 3.162 |
| Decile 8 | 3.101 |
| Decile 7 | 3.058 |
| Decile 6 | 3.02 |
| Median | 2.987 |
| Decile 4 | 2.954 |
| Decile 3 | 2.916 |
| Decile 2 | 2.871 |
| Decile 1 | 2.801 |
| Minimum | 1.727 |
|
|
- Mean = 2.98364
- Std.dev = 0.144626
- 2 items below graph minimum of 2.44
- 1 item above graph maximum of 3.523
|
Notes
Mean thickness of inferiortemporal in the left hemisphere generated by parcellation of the white surface using Desikan-Killiany parcellation
0 Related Data-Fields
There are no related data-fields
0 Resources
There are no matching Resources
