Data
87,996 items of data are available, covering 83,313 participants.
Defined-instances run from 2 to 3, labelled using Instancing
2.
Units of measurement are mm3.
| Maximum | 1966.43 |
| Decile 9 | 863.078 |
| Decile 8 | 819.583 |
| Decile 7 | 789.844 |
| Decile 6 | 765.181 |
| Median | 742.856 |
| Decile 4 | 721.135 |
| Decile 3 | 698.778 |
| Decile 2 | 673.577 |
| Decile 1 | 640.133 |
| Minimum | 393.997 |
|

|
- Mean = 748.259
- Std.dev = 88.1718
- 2 items below graph minimum of 417.189
- 70 items above graph maximum of 1086.02
|
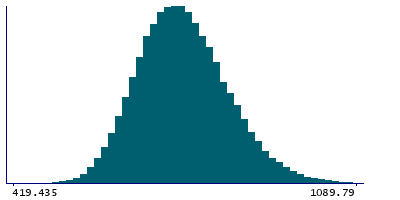
2 Instances
Instance 2 : Imaging visit (2014+)
83,241 participants, 83,241 items
| Maximum | 1966.43 |
| Decile 9 | 862.827 |
| Decile 8 | 819.265 |
| Decile 7 | 789.59 |
| Decile 6 | 764.896 |
| Median | 742.578 |
| Decile 4 | 720.761 |
| Decile 3 | 698.458 |
| Decile 2 | 673.278 |
| Decile 1 | 639.859 |
| Minimum | 393.997 |
|
|
- Mean = 747.924
- Std.dev = 88.0835
- 2 items below graph minimum of 416.89
- 66 items above graph maximum of 1085.8
|
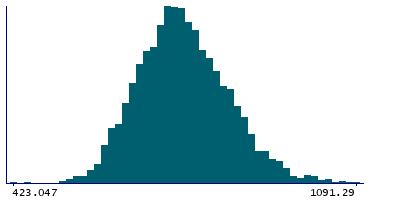
Instance 3 : First repeat imaging visit (2019+)
4,755 participants, 4,755 items
| Maximum | 1744.42 |
| Decile 9 | 868.317 |
| Decile 8 | 826.421 |
| Decile 7 | 795.197 |
| Decile 6 | 770.28 |
| Median | 748.388 |
| Decile 4 | 727.909 |
| Decile 3 | 705.729 |
| Decile 2 | 679.026 |
| Decile 1 | 645.794 |
| Minimum | 422.949 |
|
|
- Mean = 754.127
- Std.dev = 89.5005
- 1 item below graph minimum of 423.271
- 5 items above graph maximum of 1090.84
|
Notes
Volume of VLp in the left hemisphere generated by subcortical volumetric sub-segmentation of the Thalamic Nuclei
0 Related Data-Fields
There are no related data-fields
0 Resources
There are no matching Resources
