Data
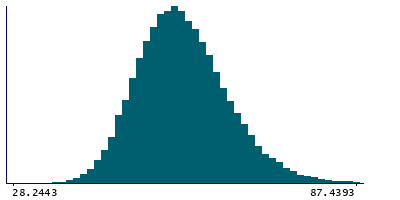
87,996 items of data are available, covering 83,313 participants.
Defined-instances run from 2 to 3, labelled using Instancing
2.
Units of measurement are mm3.
| Maximum | 117.83 |
| Decile 9 | 67.5102 |
| Decile 8 | 63.5004 |
| Decile 7 | 60.8272 |
| Decile 6 | 58.6214 |
| Median | 56.6662 |
| Decile 4 | 54.808 |
| Decile 3 | 52.8773 |
| Decile 2 | 50.6944 |
| Decile 1 | 47.825 |
| Minimum | 12.7419 |
|
|
- Mean = 57.281
- Std.dev = 7.85041
- 15 items below graph minimum of 28.1397
- 116 items above graph maximum of 87.1954
|
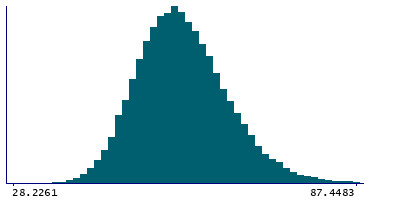
2 Instances
Instance 2 : Imaging visit (2014+)
83,241 participants, 83,241 items
| Maximum | 104.315 |
| Decile 9 | 67.4905 |
| Decile 8 | 63.4891 |
| Decile 7 | 60.8083 |
| Decile 6 | 58.5978 |
| Median | 56.6414 |
| Decile 4 | 54.786 |
| Decile 3 | 52.8516 |
| Decile 2 | 50.681 |
| Decile 1 | 47.813 |
| Minimum | 12.7419 |
|
|
- Mean = 57.2645
- Std.dev = 7.85376
- 13 items below graph minimum of 28.1356
- 111 items above graph maximum of 87.1679
|
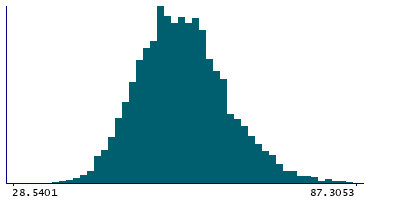
Instance 3 : First repeat imaging visit (2019+)
4,755 participants, 4,755 items
| Maximum | 117.83 |
| Decile 9 | 67.7169 |
| Decile 8 | 63.6966 |
| Decile 7 | 61.0959 |
| Decile 6 | 59.1129 |
| Median | 57.1083 |
| Decile 4 | 55.0884 |
| Decile 3 | 53.3263 |
| Decile 2 | 51.02 |
| Decile 1 | 48.1285 |
| Minimum | 26.6062 |
|
|
- Mean = 57.5692
- Std.dev = 7.78585
- 2 items below graph minimum of 28.5401
- 6 items above graph maximum of 87.3053
|
Notes
Volume of Pf in the left hemisphere generated by subcortical volumetric sub-segmentation of the Thalamic Nuclei
0 Related Data-Fields
There are no related data-fields
0 Resources
There are no matching Resources
