Data
87,996 items of data are available, covering 83,313 participants.
Defined-instances run from 2 to 3, labelled using Instancing
2.
Units of measurement are mm3.
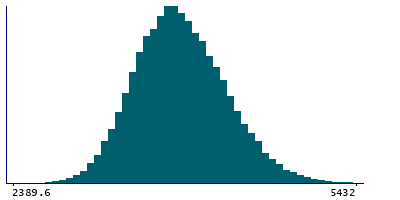
| Maximum | 6556.1 |
| Decile 9 | 4355.8 |
| Decile 8 | 4161.1 |
| Decile 7 | 4020.95 |
| Decile 6 | 3906.3 |
| Median | 3804.6 |
| Decile 4 | 3705.25 |
| Decile 3 | 3599.1 |
| Decile 2 | 3482.8 |
| Decile 1 | 3327.9 |
| Minimum | 1530.1 |
|
|
- Mean = 3826.54
- Std.dev = 403.877
- 2 items below graph minimum of 2300
- 42 items above graph maximum of 5383.7
|
2 Instances
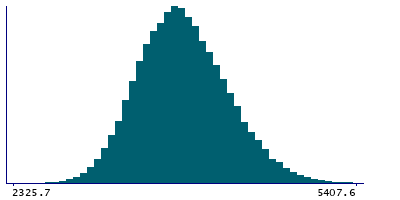
Instance 2 : Imaging visit (2014+)
83,241 participants, 83,241 items
| Maximum | 6556.1 |
| Decile 9 | 4353.4 |
| Decile 8 | 4158.5 |
| Decile 7 | 4018.5 |
| Decile 6 | 3903.65 |
| Median | 3802.7 |
| Decile 4 | 3702.8 |
| Decile 3 | 3597 |
| Decile 2 | 3480 |
| Decile 1 | 3325 |
| Minimum | 1530.1 |
|
|
- Mean = 3824.14
- Std.dev = 404.179
- 2 items below graph minimum of 2296.6
- 39 items above graph maximum of 5381.8
|
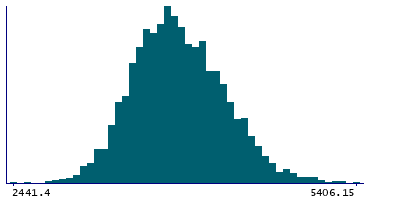
Instance 3 : First repeat imaging visit (2019+)
4,755 participants, 4,755 items
| Maximum | 5760.5 |
| Decile 9 | 4393 |
| Decile 8 | 4200.4 |
| Decile 7 | 4063.9 |
| Decile 6 | 3946.6 |
| Median | 3843.65 |
| Decile 4 | 3747.7 |
| Decile 3 | 3642.95 |
| Decile 2 | 3533.7 |
| Decile 1 | 3381.35 |
| Minimum | 2441.4 |
|
|
- Mean = 3868.55
- Std.dev = 396.214
- 2 items above graph maximum of 5404.65
|
Notes
Volume of VentralDC in the right hemisphere generated by subcortical volumetric segmentation (aseg)
0 Related Data-Fields
There are no related data-fields
0 Resources
There are no matching Resources
