Data
87,996 items of data are available, covering 83,313 participants.
Defined-instances run from 2 to 3, labelled using Instancing
2.
Units of measurement are AU.
| Maximum | 69.0562 |
| Decile 9 | 48.761 |
| Decile 8 | 46.3884 |
| Decile 7 | 44.7719 |
| Decile 6 | 43.446 |
| Median | 42.2327 |
| Decile 4 | 41.0712 |
| Decile 3 | 39.874 |
| Decile 2 | 38.4845 |
| Decile 1 | 36.5972 |
| Minimum | 21.4671 |
|

|
- Mean = 42.4822
- Std.dev = 4.83674
- 17 items below graph minimum of 24.4334
- 46 items above graph maximum of 60.9248
|
2 Instances
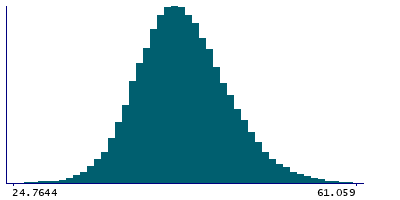
Instance 2 : Imaging visit (2014+)
83,241 participants, 83,241 items
| Maximum | 69.0562 |
| Decile 9 | 48.7351 |
| Decile 8 | 46.3685 |
| Decile 7 | 44.7434 |
| Decile 6 | 43.4205 |
| Median | 42.2137 |
| Decile 4 | 41.0538 |
| Decile 3 | 39.8528 |
| Decile 2 | 38.4717 |
| Decile 1 | 36.5902 |
| Minimum | 21.4671 |
|
|
- Mean = 42.4618
- Std.dev = 4.83184
- 15 items below graph minimum of 24.4453
- 47 items above graph maximum of 60.88
|
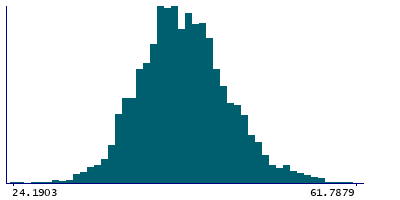
Instance 3 : First repeat imaging visit (2019+)
4,755 participants, 4,755 items
| Maximum | 62.24 |
| Decile 9 | 49.2472 |
| Decile 8 | 46.7748 |
| Decile 7 | 45.1923 |
| Decile 6 | 43.8922 |
| Median | 42.6364 |
| Decile 4 | 41.4244 |
| Decile 3 | 40.2362 |
| Decile 2 | 38.7288 |
| Decile 1 | 36.7065 |
| Minimum | 24.1903 |
|
|
- Mean = 42.84
- Std.dev = 4.90794
- 1 item above graph maximum of 61.7879
|
Notes
Mean intensity of Inf-Lat-Vent in the right hemisphere generated by subcortical volumetric segmentation (aseg)
0 Related Data-Fields
There are no related data-fields
0 Resources
There are no matching Resources
