Data
87,996 items of data are available, covering 83,313 participants.
Defined-instances run from 2 to 3, labelled using Instancing
2.
Units of measurement are AU.
| Maximum | 71.1949 |
| Decile 9 | 52.7841 |
| Decile 8 | 51.5157 |
| Decile 7 | 50.6861 |
| Decile 6 | 50.0027 |
| Median | 49.3819 |
| Decile 4 | 48.785 |
| Decile 3 | 48.1585 |
| Decile 2 | 47.4346 |
| Decile 1 | 46.4353 |
| Minimum | 39.358 |
|
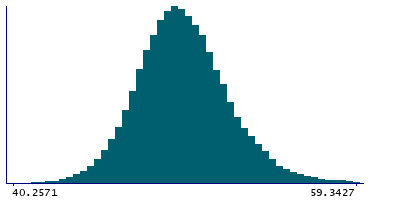
|
- Mean = 49.5201
- Std.dev = 2.56744
- 3 items below graph minimum of 40.0866
- 107 items above graph maximum of 59.1329
|
2 Instances
Instance 2 : Imaging visit (2014+)
83,241 participants, 83,241 items
| Maximum | 71.1949 |
| Decile 9 | 52.7588 |
| Decile 8 | 51.5018 |
| Decile 7 | 50.6707 |
| Decile 6 | 49.9855 |
| Median | 49.3618 |
| Decile 4 | 48.7642 |
| Decile 3 | 48.139 |
| Decile 2 | 47.4165 |
| Decile 1 | 46.4223 |
| Minimum | 39.358 |
|
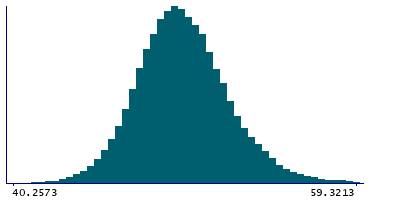
|
- Mean = 49.5032
- Std.dev = 2.56728
- 3 items below graph minimum of 40.0858
- 108 items above graph maximum of 59.0953
|
Instance 3 : First repeat imaging visit (2019+)
4,755 participants, 4,755 items
| Maximum | 60.9559 |
| Decile 9 | 53.1403 |
| Decile 8 | 51.7816 |
| Decile 7 | 50.9725 |
| Decile 6 | 50.2846 |
| Median | 49.6748 |
| Decile 4 | 49.1368 |
| Decile 3 | 48.535 |
| Decile 2 | 47.7982 |
| Decile 1 | 46.7054 |
| Minimum | 40.6976 |
|
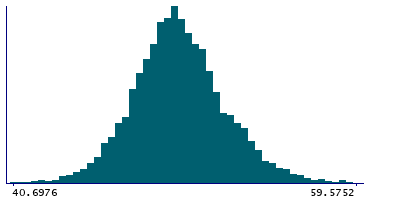
|
- Mean = 49.8159
- Std.dev = 2.55227
- 4 items above graph maximum of 59.5752
|
Notes
Mean intensity of choroid-plexus in the left hemisphere generated by subcortical volumetric segmentation (aseg)
0 Related Data-Fields
There are no related data-fields
0 Resources
There are no matching Resources
