Data
87,996 items of data are available, covering 83,313 participants.
Defined-instances run from 2 to 3, labelled using Instancing
2.
Units of measurement are AU.
| Maximum | 78.1424 |
| Decile 9 | 70.6166 |
| Decile 8 | 70.0084 |
| Decile 7 | 69.5751 |
| Decile 6 | 69.193 |
| Median | 68.823 |
| Decile 4 | 68.4224 |
| Decile 3 | 67.9718 |
| Decile 2 | 67.3879 |
| Decile 1 | 66.4689 |
| Minimum | 46.3534 |
|

|
- Mean = 68.6451
- Std.dev = 1.71652
- 251 items below graph minimum of 62.3212
- 15 items above graph maximum of 74.7642
|
2 Instances
Instance 2 : Imaging visit (2014+)
83,241 participants, 83,241 items
| Maximum | 78.1424 |
| Decile 9 | 70.6141 |
| Decile 8 | 70.0061 |
| Decile 7 | 69.572 |
| Decile 6 | 69.1901 |
| Median | 68.8186 |
| Decile 4 | 68.4167 |
| Decile 3 | 67.9676 |
| Decile 2 | 67.3827 |
| Decile 1 | 66.4651 |
| Minimum | 46.3534 |
|

|
- Mean = 68.6414
- Std.dev = 1.7161
- 240 items below graph minimum of 62.3161
- 13 items above graph maximum of 74.7632
|
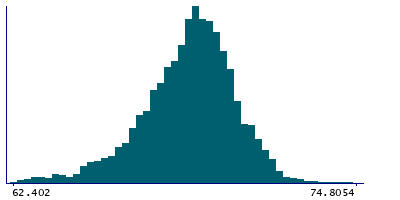
Instance 3 : First repeat imaging visit (2019+)
4,755 participants, 4,755 items
| Maximum | 77.1123 |
| Decile 9 | 70.6701 |
| Decile 8 | 70.0516 |
| Decile 7 | 69.6263 |
| Decile 6 | 69.2508 |
| Median | 68.9015 |
| Decile 4 | 68.5293 |
| Decile 3 | 68.0505 |
| Decile 2 | 67.4571 |
| Decile 1 | 66.5387 |
| Minimum | 52.6006 |
|
|
- Mean = 68.7114
- Std.dev = 1.72243
- 10 items below graph minimum of 62.4074
- 2 items above graph maximum of 74.8014
|
Notes
Mean intensity of Hippocampus in the left hemisphere generated by subcortical volumetric segmentation (aseg)
0 Related Data-Fields
There are no related data-fields
0 Resources
There are no matching Resources
