Data
87,996 items of data are available, covering 83,313 participants.
Defined-instances run from 2 to 3, labelled using Instancing
2.
Units of measurement are AU.
| Maximum | 68 |
| Decile 9 | 50.925 |
| Decile 8 | 48.8952 |
| Decile 7 | 47.419 |
| Decile 6 | 46.1489 |
| Median | 44.9328 |
| Decile 4 | 43.7471 |
| Decile 3 | 42.4157 |
| Decile 2 | 40.8285 |
| Decile 1 | 38.5375 |
| Minimum | 19.0744 |
|

|
- Mean = 44.8278
- Std.dev = 4.86173
- 22 items below graph minimum of 26.15
- 7 items above graph maximum of 63.3126
|
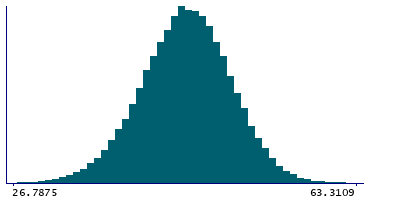
2 Instances
Instance 2 : Imaging visit (2014+)
83,241 participants, 83,241 items
| Maximum | 68 |
| Decile 9 | 50.8989 |
| Decile 8 | 48.8705 |
| Decile 7 | 47.3957 |
| Decile 6 | 46.1279 |
| Median | 44.9129 |
| Decile 4 | 43.7259 |
| Decile 3 | 42.3835 |
| Decile 2 | 40.8021 |
| Decile 1 | 38.502 |
| Minimum | 19.0744 |
|
|
- Mean = 44.802
- Std.dev = 4.86264
- 22 items below graph minimum of 26.1051
- 5 items above graph maximum of 63.2959
|
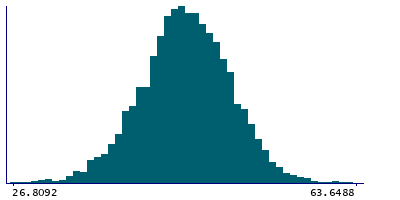
Instance 3 : First repeat imaging visit (2019+)
4,755 participants, 4,755 items
| Maximum | 68 |
| Decile 9 | 51.3689 |
| Decile 8 | 49.2843 |
| Decile 7 | 47.8307 |
| Decile 6 | 46.5372 |
| Median | 45.3295 |
| Decile 4 | 44.1659 |
| Decile 3 | 42.9218 |
| Decile 2 | 41.4329 |
| Decile 1 | 39.0891 |
| Minimum | 26.6208 |
|
|
- Mean = 45.2783
- Std.dev = 4.82347
- 1 item below graph minimum of 26.8092
- 2 items above graph maximum of 63.6488
|
Notes
Mean intensity of Inf-Lat-Vent in the left hemisphere generated by subcortical volumetric segmentation (aseg)
0 Related Data-Fields
There are no related data-fields
0 Resources
There are no matching Resources
