Data
87,996 items of data are available, covering 83,313 participants.
Defined-instances run from 2 to 3, labelled using Instancing
2.
Units of measurement are AU.
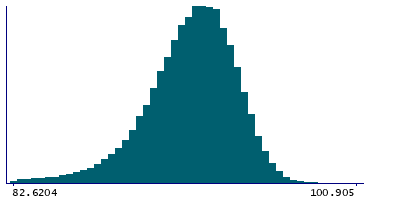
| Maximum | 107.612 |
| Decile 9 | 94.761 |
| Decile 8 | 93.9467 |
| Decile 7 | 93.3226 |
| Decile 6 | 92.7491 |
| Median | 92.1835 |
| Decile 4 | 91.5829 |
| Decile 3 | 90.8898 |
| Decile 2 | 90.002 |
| Decile 1 | 88.5108 |
| Minimum | 61.0749 |
|
|
- Mean = 91.7515
- Std.dev = 2.91977
- 1285 items below graph minimum of 82.2606
- 3 items above graph maximum of 101.011
|
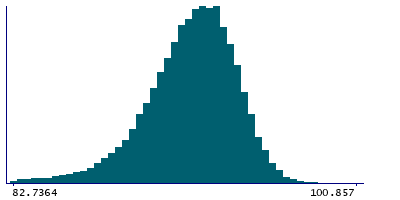
2 Instances
Instance 2 : Imaging visit (2014+)
83,241 participants, 83,241 items
| Maximum | 107.612 |
| Decile 9 | 94.7571 |
| Decile 8 | 93.9414 |
| Decile 7 | 93.3179 |
| Decile 6 | 92.7438 |
| Median | 92.1776 |
| Decile 4 | 91.5755 |
| Decile 3 | 90.8799 |
| Decile 2 | 89.9885 |
| Decile 1 | 88.4863 |
| Minimum | 61.0749 |
|
|
- Mean = 91.7397
- Std.dev = 2.93263
- 1227 items below graph minimum of 82.2154
- 3 items above graph maximum of 101.028
|
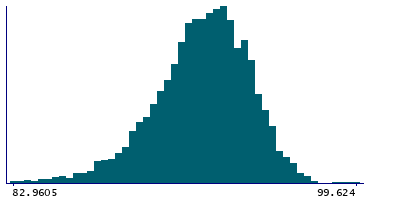
Instance 3 : First repeat imaging visit (2019+)
4,755 participants, 4,755 items
| Maximum | 99.624 |
| Decile 9 | 94.8077 |
| Decile 8 | 94.0515 |
| Decile 7 | 93.3845 |
| Decile 6 | 92.8459 |
| Median | 92.2778 |
| Decile 4 | 91.6926 |
| Decile 3 | 91.0914 |
| Decile 2 | 90.2065 |
| Decile 1 | 88.8903 |
| Minimum | 72.0774 |
|
|
- Mean = 91.9574
- Std.dev = 2.67625
- 56 items below graph minimum of 82.9729
|
Notes
Mean intensity of CC-Central in the whole brain generated by subcortical volumetric segmentation (aseg)
0 Related Data-Fields
There are no related data-fields
0 Resources
There are no matching Resources
