Data
457,927 items of data are available, covering 210,739 participants.
Defined-instances run from 0 to 4, labelled using Instancing
1.
Units of measurement are mg.
| Maximum | 15.5137 |
| Decile 9 | 2.7757 |
| Decile 8 | 2.4086 |
| Decile 7 | 2.17674 |
| Decile 6 | 1.99366 |
| Median | 1.83131 |
| Decile 4 | 1.67462 |
| Decile 3 | 1.50982 |
| Decile 2 | 1.32257 |
| Decile 1 | 1.0785 |
| Minimum | 0 |
|

|
- Mean = 1.90021
- Std.dev = 0.712175
- 2428 items above graph maximum of 4.4729
|
5 Instances
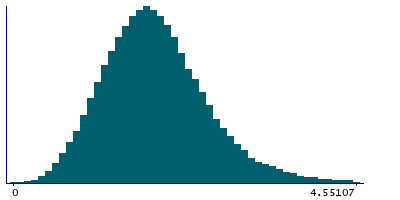
Instance 0 : Conducted in assessment centre, April 2009 to September 2010.
70,630 participants, 70,630 items
| Maximum | 15.5137 |
| Decile 9 | 2.80232 |
| Decile 8 | 2.42884 |
| Decile 7 | 2.18685 |
| Decile 6 | 1.99959 |
| Median | 1.83137 |
| Decile 4 | 1.6709 |
| Decile 3 | 1.5 |
| Decile 2 | 1.3058 |
| Decile 1 | 1.05359 |
| Minimum | 0 |
|
|
- Mean = 1.90334
- Std.dev = 0.742198
- 420 items above graph maximum of 4.55105
|
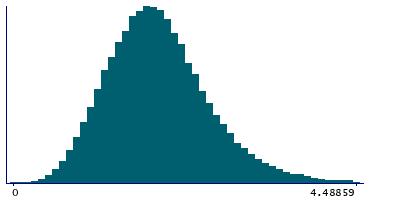
Instance 1 : On-line cycle 1, February 2011 to April 2011.
100,447 participants, 100,447 items
| Maximum | 10.3554 |
| Decile 9 | 2.79022 |
| Decile 8 | 2.42135 |
| Decile 7 | 2.18879 |
| Decile 6 | 2.0054 |
| Median | 1.84396 |
| Decile 4 | 1.68639 |
| Decile 3 | 1.5226 |
| Decile 2 | 1.33381 |
| Decile 1 | 1.09154 |
| Minimum | 0 |
|
|
- Mean = 1.91218
- Std.dev = 0.710221
- 527 items above graph maximum of 4.48891
|
Instance 2 : On-line cycle 2, June 2011 to September 2011.
83,140 participants, 83,140 items
| Maximum | 13.5205 |
| Decile 9 | 2.75206 |
| Decile 8 | 2.39666 |
| Decile 7 | 2.16756 |
| Decile 6 | 1.9844 |
| Median | 1.82406 |
| Decile 4 | 1.66737 |
| Decile 3 | 1.50236 |
| Decile 2 | 1.31571 |
| Decile 1 | 1.07146 |
| Minimum | 0 |
|

|
- Mean = 1.8911
- Std.dev = 0.70898
- 459 items above graph maximum of 4.43265
|
Instance 3 : On-line cycle 3, October 2011 to December 2011.
103,616 participants, 103,616 items
| Maximum | 12.0074 |
| Decile 9 | 2.75661 |
| Decile 8 | 2.38938 |
| Decile 7 | 2.16082 |
| Decile 6 | 1.97994 |
| Median | 1.8193 |
| Decile 4 | 1.66428 |
| Decile 3 | 1.50228 |
| Decile 2 | 1.31733 |
| Decile 1 | 1.07582 |
| Minimum | 0 |
|

|
- Mean = 1.88739
- Std.dev = 0.701317
- 504 items above graph maximum of 4.43741
|
Instance 4 : On-line cycle 4, April 2012 to June 2012.
100,094 participants, 100,094 items
| Maximum | 13.6541 |
| Decile 9 | 2.77749 |
| Decile 8 | 2.4123 |
| Decile 7 | 2.18154 |
| Decile 6 | 2.00036 |
| Median | 1.83764 |
| Decile 4 | 1.6818 |
| Decile 3 | 1.51863 |
| Decile 2 | 1.33361 |
| Decile 1 | 1.09122 |
| Minimum | 0 |
|

|
- Mean = 1.90681
- Std.dev = 0.705971
- 511 items above graph maximum of 4.46376
|
