Data
457,927 items of data are available, covering 210,739 participants.
Defined-instances run from 0 to 4, labelled using Instancing
1.
Units of measurement are g.
| Maximum | 344.226 |
| Decile 9 | 56.1221 |
| Decile 8 | 45.1188 |
| Decile 7 | 38.3597 |
| Decile 6 | 33.1998 |
| Median | 28.8651 |
| Decile 4 | 24.8821 |
| Decile 3 | 21.0585 |
| Decile 2 | 17.0163 |
| Decile 1 | 12.1542 |
| Minimum | 0 |
|

|
- Mean = 32.2532
- Std.dev = 18.8258
- 3256 items above graph maximum of 100.09
|
5 Instances
Instance 0 : Conducted in assessment centre, April 2009 to September 2010.
70,630 participants, 70,630 items
| Maximum | 328.282 |
| Decile 9 | 56.7567 |
| Decile 8 | 45.526 |
| Decile 7 | 38.4245 |
| Decile 6 | 33.0871 |
| Median | 28.6298 |
| Decile 4 | 24.5186 |
| Decile 3 | 20.5921 |
| Decile 2 | 16.4559 |
| Decile 1 | 11.5283 |
| Minimum | 0 |
|

|
- Mean = 32.2007
- Std.dev = 19.4547
- 525 items above graph maximum of 101.985
|
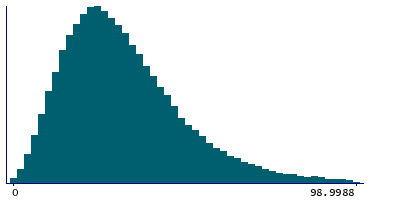
Instance 1 : On-line cycle 1, February 2011 to April 2011.
100,447 participants, 100,447 items
| Maximum | 309.001 |
| Decile 9 | 55.7322 |
| Decile 8 | 44.9161 |
| Decile 7 | 38.3411 |
| Decile 6 | 33.2633 |
| Median | 28.9702 |
| Decile 4 | 25.0573 |
| Decile 3 | 21.3018 |
| Decile 2 | 17.2775 |
| Decile 1 | 12.467 |
| Minimum | 0 |
|
|
- Mean = 32.2812
- Std.dev = 18.5306
- 707 items above graph maximum of 98.9973
|
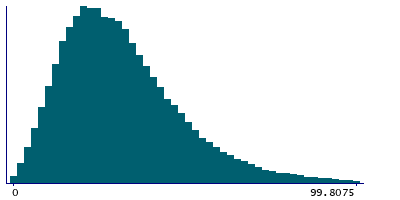
Instance 2 : On-line cycle 2, June 2011 to September 2011.
83,140 participants, 83,140 items
| Maximum | 273.931 |
| Decile 9 | 55.9348 |
| Decile 8 | 45.0997 |
| Decile 7 | 38.3442 |
| Decile 6 | 33.173 |
| Median | 28.8934 |
| Decile 4 | 24.7835 |
| Decile 3 | 20.8941 |
| Decile 2 | 16.8878 |
| Decile 1 | 12.0589 |
| Minimum | 0 |
|
|
- Mean = 32.1298
- Std.dev = 18.7272
- 552 items above graph maximum of 99.8107
|
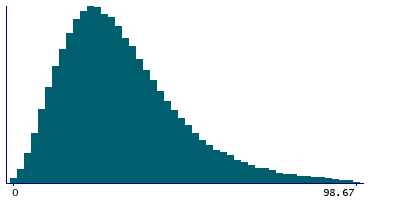
Instance 3 : On-line cycle 3, October 2011 to December 2011.
103,616 participants, 103,616 items
| Maximum | 245.267 |
| Decile 9 | 55.3902 |
| Decile 8 | 44.3504 |
| Decile 7 | 37.6999 |
| Decile 6 | 32.6778 |
| Median | 28.4351 |
| Decile 4 | 24.5307 |
| Decile 3 | 20.8337 |
| Decile 2 | 16.9095 |
| Decile 1 | 12.1207 |
| Minimum | 0 |
|
|
- Mean = 31.8209
- Std.dev = 18.4867
- 726 items above graph maximum of 98.6597
|
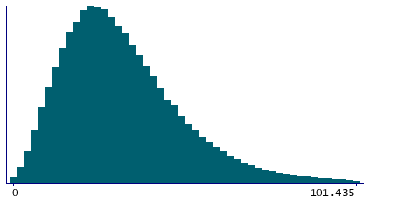
Instance 4 : On-line cycle 4, April 2012 to June 2012.
100,094 participants, 100,094 items
| Maximum | 344.226 |
| Decile 9 | 56.9206 |
| Decile 8 | 45.853 |
| Decile 7 | 38.9994 |
| Decile 6 | 33.818 |
| Median | 29.3882 |
| Decile 4 | 25.4017 |
| Decile 3 | 21.531 |
| Decile 2 | 17.376 |
| Decile 1 | 12.4084 |
| Minimum | 0 |
|
|
- Mean = 32.8122
- Std.dev = 19.0823
- 716 items above graph maximum of 101.433
|
