Data
517,282 items of data are available, covering 497,123 participants.
Defined-instances run from 0 to 1, labelled using Instancing
2.
Units of measurement are percent.
| Maximum | 100 |
| Decile 9 | 63.17 |
| Decile 8 | 45.759 |
| Decile 7 | 34.598 |
| Decile 6 | 25.893 |
| Median | 18.973 |
| Decile 4 | 13.393 |
| Decile 3 | 8.259 |
| Decile 2 | 3.795 |
| Decile 1 | 0 |
| Minimum | 0 |
|

|
- Mean = 26.2665
- Std.dev = 25.1647
|
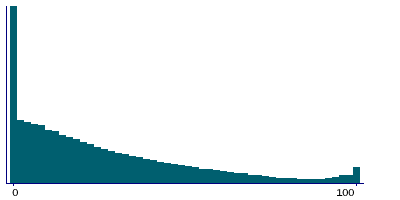
2 Instances
Instance 0 : Initial assessment visit (2006-2010) at which participants were recruited and consent given
496,977 participants, 496,977 items
| Maximum | 100 |
| Decile 9 | 62.946 |
| Decile 8 | 45.536 |
| Decile 7 | 34.375 |
| Decile 6 | 25.67 |
| Median | 18.973 |
| Decile 4 | 13.17 |
| Decile 3 | 8.259 |
| Decile 2 | 3.795 |
| Decile 1 | 0 |
| Minimum | 0 |
|
|
- Mean = 26.0941
- Std.dev = 25.1033
|
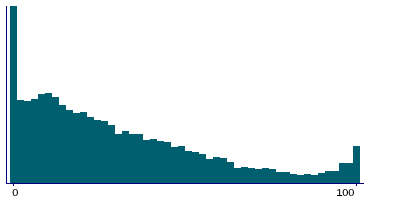
Instance 1 : First repeat assessment visit (2012-13)
20,305 participants, 20,305 items
| Maximum | 100 |
| Decile 9 | 70.089 |
| Decile 8 | 51.116 |
| Decile 7 | 40.179 |
| Decile 6 | 31.25 |
| Median | 23.661 |
| Decile 4 | 17.411 |
| Decile 3 | 12.054 |
| Decile 2 | 7.143 |
| Decile 1 | 2.009 |
| Minimum | 0 |
|
|
- Mean = 30.4838
- Std.dev = 26.2741
|
Notes
The percentage of the home location buffer classed as 'Natural Environment' in the Land Cover Map (LCM) 2007, and with home location data buffered at 300m.
Land use data were obtained from the Land Cover Map, 2007, and the 23 land cover classes were reclassified to a binary classification; classes 1-2 ('Natural Environment'), and 22-23 ('Built environment').
Further details of the methods used to derive these data can be found in Resource 15374, where this field is derived from variables referred to as ne300_0 and ne300_1.
0 Related Data-Fields
There are no related data-fields

