Data
77,958 items of data are available, covering 73,705 participants.
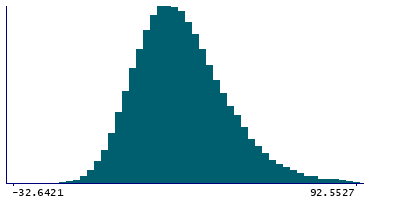
Defined-instances run from 2 to 3, labelled using Instancing
2.
| Maximum | 187.085 |
| Decile 9 | 52.7016 |
| Decile 8 | 43.529 |
| Decile 7 | 37.2958 |
| Decile 6 | 32.4275 |
| Median | 28.184 |
| Decile 4 | 24.0785 |
| Decile 3 | 19.971 |
| Decile 2 | 15.4994 |
| Decile 1 | 9.62916 |
| Minimum | -46.7996 |
|
|
- Mean = 30.0708
- Std.dev = 17.508
- 1 item below graph minimum of -33.4433
- 233 items above graph maximum of 95.774
|
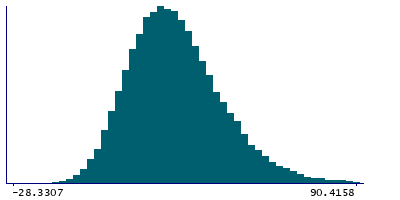
2 Instances
Instance 2 : Imaging visit (2014+)
73,327 participants, 73,327 items
| Maximum | 187.085 |
| Decile 9 | 52.9268 |
| Decile 8 | 43.6963 |
| Decile 7 | 37.4607 |
| Decile 6 | 32.5904 |
| Median | 28.331 |
| Decile 4 | 24.2098 |
| Decile 3 | 20.0907 |
| Decile 2 | 15.5964 |
| Decile 1 | 9.73024 |
| Minimum | -46.7996 |
|
|
- Mean = 30.2172
- Std.dev = 17.555
- 1 item below graph minimum of -33.4664
- 221 items above graph maximum of 96.1234
|
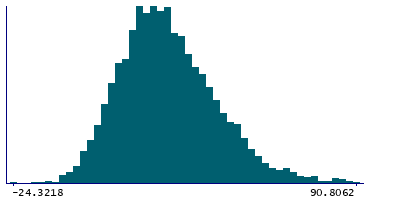
Instance 3 : First repeat imaging visit (2019+)
4,631 participants, 4,631 items
| Maximum | 133.476 |
| Decile 9 | 49.5732 |
| Decile 8 | 40.8435 |
| Decile 7 | 34.7294 |
| Decile 6 | 30.1057 |
| Median | 25.9638 |
| Decile 4 | 22.1042 |
| Decile 3 | 18.2408 |
| Decile 2 | 14.0927 |
| Decile 1 | 8.34014 |
| Minimum | -24.3218 |
|
|
- Mean = 27.7535
- Std.dev = 16.5755
- 8 items above graph maximum of 90.8062
|
Notes
Median magnetic susceptibility in right putamen (from QSM processing of SWI data)
0 Related Data-Fields
There are no related data-fields


