Data
75,079 items of data are available, covering 70,785 participants.
Defined-instances run from 2 to 3, labelled using Instancing
2.
| Maximum | 2.47363 |
| Decile 9 | 0.238095 |
| Decile 8 | 0.196835 |
| Decile 7 | 0.172789 |
| Decile 6 | 0.154963 |
| Median | 0.140151 |
| Decile 4 | 0.126692 |
| Decile 3 | 0.114371 |
| Decile 2 | 0.101547 |
| Decile 1 | 0.0865797 |
| Minimum | 0.0309171 |
|
|
- Mean = 0.154581
- Std.dev = 0.069604
- 760 items above graph maximum of 0.389611
|
2 Instances
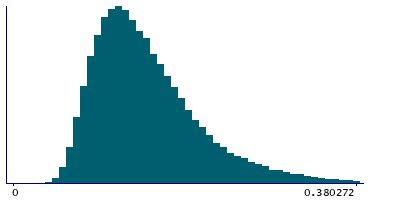
Instance 2 : Imaging visit (2014+)
70,421 participants, 70,421 items
| Maximum | 2.47363 |
| Decile 9 | 0.239181 |
| Decile 8 | 0.197632 |
| Decile 7 | 0.1735 |
| Decile 6 | 0.155513 |
| Median | 0.140649 |
| Decile 4 | 0.127122 |
| Decile 3 | 0.114711 |
| Decile 2 | 0.101814 |
| Decile 1 | 0.0868148 |
| Minimum | 0.0329789 |
|

|
- Mean = 0.155179
- Std.dev = 0.0700975
- 721 items above graph maximum of 0.391547
|
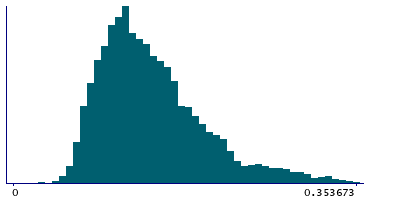
Instance 3 : First repeat imaging visit (2019+)
4,658 participants, 4,658 items
| Maximum | 1.06056 |
| Decile 9 | 0.21887 |
| Decile 8 | 0.184439 |
| Decile 7 | 0.16244 |
| Decile 6 | 0.146944 |
| Median | 0.133177 |
| Decile 4 | 0.120357 |
| Decile 3 | 0.109751 |
| Decile 2 | 0.0982464 |
| Decile 1 | 0.0839541 |
| Minimum | 0.0309171 |
|
|
- Mean = 0.145534
- Std.dev = 0.0609525
- 42 items above graph maximum of 0.353787
|