Data
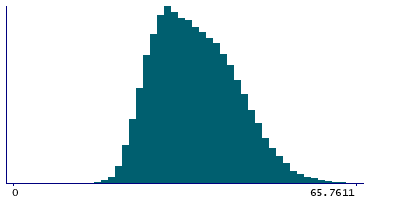
74,397 items of data are available, covering 69,019 participants.
Defined-instances run from 2 to 3, labelled using Instancing
2.
Units of measurement are g.
| Maximum | 104.047 |
| Decile 9 | 45.3134 |
| Decile 8 | 41.5454 |
| Decile 7 | 38.7202 |
| Decile 6 | 36.2071 |
| Median | 33.8581 |
| Decile 4 | 31.6372 |
| Decile 3 | 29.5156 |
| Decile 2 | 27.4394 |
| Decile 1 | 24.9818 |
| Minimum | 0 |
|

|
- Mean = 34.6077
- Std.dev = 7.8886
- 26 items above graph maximum of 65.6451
|
2 Instances
Instance 2 : Imaging visit (2014+)
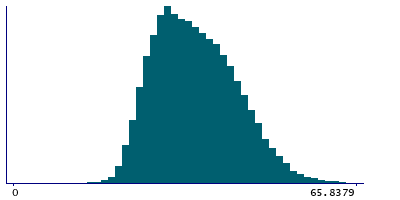
68,649 participants, 68,649 items
| Maximum | 104.047 |
| Decile 9 | 45.3358 |
| Decile 8 | 41.5585 |
| Decile 7 | 38.7231 |
| Decile 6 | 36.2094 |
| Median | 33.8682 |
| Decile 4 | 31.6398 |
| Decile 3 | 29.5221 |
| Decile 2 | 27.4531 |
| Decile 1 | 24.9938 |
| Minimum | 0 |
|

|
- Mean = 34.617
- Std.dev = 7.89467
- 24 items above graph maximum of 65.6779
|
Instance 3 : First repeat imaging visit (2019+)
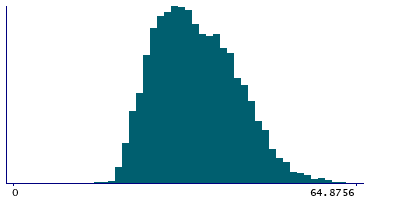
5,748 participants, 5,748 items
| Maximum | 71.2913 |
| Decile 9 | 45.0481 |
| Decile 8 | 41.3879 |
| Decile 7 | 38.6808 |
| Decile 6 | 36.1758 |
| Median | 33.7953 |
| Decile 4 | 31.6158 |
| Decile 3 | 29.4432 |
| Decile 2 | 27.3039 |
| Decile 1 | 24.8474 |
| Minimum | 15.6401 |
|

|
- Mean = 34.4965
- Std.dev = 7.81485
- 2 items above graph maximum of 65.2487
|
Notes
Total bone mineral content for the right femur, from DXA output.
0 Related Data-Fields
There are no related data-fields
1 Application
| Application ID | Title |
|---|
| 17295 | AUtomated Generation of Musculoskeletal phENotypes from the UK biobank exTended imaging study (AUGMENT Study) |


