Data
78,098 items of data are available, covering 72,083 participants.
Defined-instances run from 2 to 3, labelled using Instancing
2.
Units of measurement are cm3.
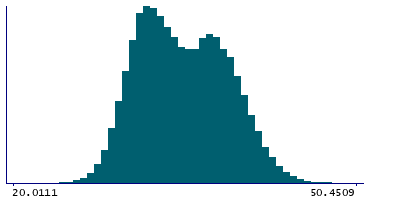
| Maximum | 59.165 |
| Decile 9 | 40.2469 |
| Decile 8 | 38.6572 |
| Decile 7 | 37.3579 |
| Decile 6 | 36.0861 |
| Median | 34.7282 |
| Decile 4 | 33.476 |
| Decile 3 | 32.3696 |
| Decile 2 | 31.3111 |
| Decile 1 | 30.0911 |
| Minimum | 0 |
|
|
- Mean = 34.981
- Std.dev = 3.944
- 14 items below graph minimum of 19.9352
- 6 items above graph maximum of 50.4028
|
2 Instances
Instance 2 : Imaging visit (2014+)
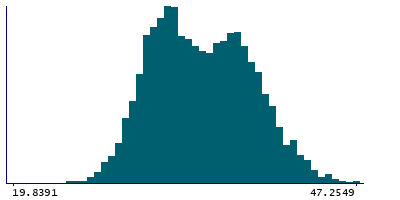
71,790 participants, 71,790 items
| Maximum | 59.165 |
| Decile 9 | 40.2489 |
| Decile 8 | 38.6607 |
| Decile 7 | 37.3571 |
| Decile 6 | 36.0806 |
| Median | 34.7269 |
| Decile 4 | 33.4791 |
| Decile 3 | 32.3721 |
| Decile 2 | 31.3176 |
| Decile 1 | 30.0999 |
| Minimum | 0 |
|

|
- Mean = 34.9838
- Std.dev = 3.93938
- 13 items below graph minimum of 19.9509
- 6 items above graph maximum of 50.3978
|
Instance 3 : First repeat imaging visit (2019+)
6,308 participants, 6,308 items
| Maximum | 47.318 |
| Decile 9 | 40.2143 |
| Decile 8 | 38.6427 |
| Decile 7 | 37.3764 |
| Decile 6 | 36.1378 |
| Median | 34.753 |
| Decile 4 | 33.4436 |
| Decile 3 | 32.3396 |
| Decile 2 | 31.2358 |
| Decile 1 | 29.9705 |
| Minimum | 0 |
|
|
- Mean = 34.949
- Std.dev = 3.99603
- 1 item below graph minimum of 19.7268
|
Notes
Total bone area for the left femur, from DXA output.
0 Related Data-Fields
There are no related data-fields
1 Application
| Application ID | Title |
|---|
| 17295 | AUtomated Generation of Musculoskeletal phENotypes from the UK biobank exTended imaging study (AUGMENT Study) |