Data
38,775 items of data are available, covering 36,999 participants.
Defined-instances run from 2 to 3, labelled using Instancing
2.
Units of measurement are g/cm2.
| Maximum | 2.3298 |
| Decile 9 | 1.30991 |
| Decile 8 | 1.23601 |
| Decile 7 | 1.18256 |
| Decile 6 | 1.14047 |
| Median | 1.10062 |
| Decile 4 | 1.06354 |
| Decile 3 | 1.024 |
| Decile 2 | 0.978571 |
| Decile 1 | 0.92 |
| Minimum | 0 |
|

|
- Mean = 1.10955
- Std.dev = 0.154371
- 16 items below graph minimum of 0.530087
- 25 items above graph maximum of 1.69983
|
2 Instances
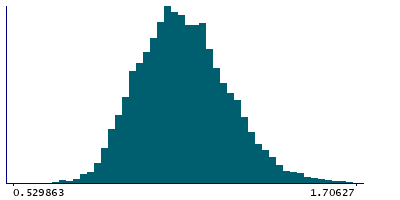
Instance 2 : Imaging visit (2014+)
36,388 participants, 36,388 items
| Maximum | 2.3298 |
| Decile 9 | 1.31052 |
| Decile 8 | 1.2366 |
| Decile 7 | 1.18298 |
| Decile 6 | 1.14091 |
| Median | 1.1009 |
| Decile 4 | 1.06386 |
| Decile 3 | 1.02431 |
| Decile 2 | 0.978716 |
| Decile 1 | 0.920081 |
| Minimum | 0 |
|
|
- Mean = 1.1099
- Std.dev = 0.154782
- 16 items below graph minimum of 0.529639
- 23 items above graph maximum of 1.70097
|
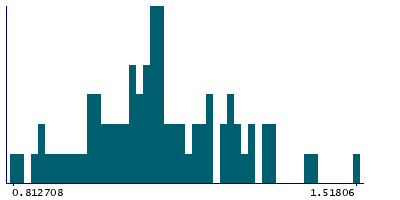
Instance 3 : First repeat imaging visit (2019+)
2,387 participants, 2,387 items
| Maximum | 1.83123 |
| Decile 9 | 1.29816 |
| Decile 8 | 1.22439 |
| Decile 7 | 1.17812 |
| Decile 6 | 1.13297 |
| Median | 1.09679 |
| Decile 4 | 1.05973 |
| Decile 3 | 1.01971 |
| Decile 2 | 0.977152 |
| Decile 1 | 0.916645 |
| Minimum | 0.657507 |
|
|
- Mean = 1.10414
- Std.dev = 0.147857
- 2 items above graph maximum of 1.67968
|