Data
73,670 items of data are available, covering 68,408 participants.
Defined-instances run from 2 to 3, labelled using Instancing
2.
Units of measurement are cm.
| Maximum | 17.2182 |
| Decile 9 | 14.9008 |
| Decile 8 | 14.5063 |
| Decile 7 | 14.2055 |
| Decile 6 | 13.9522 |
| Median | 13.7147 |
| Decile 4 | 13.4808 |
| Decile 3 | 13.2325 |
| Decile 2 | 12.9403 |
| Decile 1 | 12.5231 |
| Minimum | 8.72687 |
|

|
- Mean = 13.7115
- Std.dev = 0.932886
- 30 items below graph minimum of 10.1455
|
2 Instances
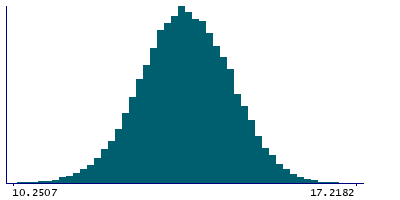
Instance 2 : Imaging visit (2014+)
68,015 participants, 68,015 items
| Maximum | 17.2182 |
| Decile 9 | 14.8949 |
| Decile 8 | 14.4992 |
| Decile 7 | 14.2007 |
| Decile 6 | 13.9499 |
| Median | 13.7123 |
| Decile 4 | 13.4794 |
| Decile 3 | 13.2314 |
| Decile 2 | 12.9363 |
| Decile 1 | 12.5189 |
| Minimum | 8.72687 |
|
|
- Mean = 13.7076
- Std.dev = 0.932296
- 28 items below graph minimum of 10.1428
|
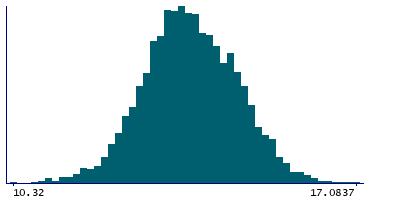
Instance 3 : First repeat imaging visit (2019+)
5,655 participants, 5,655 items
| Maximum | 17.0837 |
| Decile 9 | 14.9606 |
| Decile 8 | 14.5798 |
| Decile 7 | 14.2578 |
| Decile 6 | 13.979 |
| Median | 13.7434 |
| Decile 4 | 13.5172 |
| Decile 3 | 13.2729 |
| Decile 2 | 12.9825 |
| Decile 1 | 12.5784 |
| Minimum | 9.44641 |
|
|
- Mean = 13.7577
- Std.dev = 0.93872
- 2 items below graph minimum of 10.1961
|