Data
50,584 items of data are available, covering 46,667 participants.
Defined-instances run from 2 to 3, labelled using Instancing
2.
Units of measurement are ms.
| Maximum | 875 |
| Decile 9 | 452 |
| Decile 8 | 440 |
| Decile 7 | 433 |
| Decile 6 | 426 |
| Median | 420 |
| Decile 4 | 414 |
| Decile 3 | 409 |
| Decile 2 | 402 |
| Decile 1 | 392 |
| Minimum | 174 |
|

|
- There are 286 distinct values.
- Mean = 421.69
- Std.dev = 25.6445
- 16 items below graph minimum of 332
- 155 items above graph maximum of 512
|
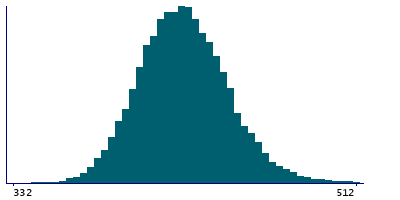
2 Instances
Instance 2 : Imaging visit (2014+)
46,392 participants, 46,392 items
| Maximum | 875 |
| Decile 9 | 452 |
| Decile 8 | 440 |
| Decile 7 | 433 |
| Decile 6 | 426 |
| Median | 420 |
| Decile 4 | 414 |
| Decile 3 | 409 |
| Decile 2 | 402 |
| Decile 1 | 392 |
| Minimum | 184 |
|
|
- There are 281 distinct values.
- Mean = 421.701
- Std.dev = 25.7295
- 15 items below graph minimum of 332
- 148 items above graph maximum of 512
|
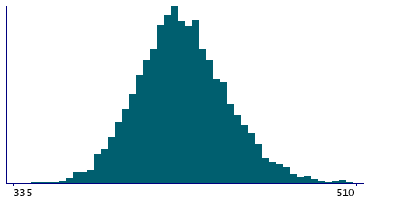
Instance 3 : First repeat imaging visit (2019+)
4,192 participants, 4,192 items
| Maximum | 715 |
| Decile 9 | 451.5 |
| Decile 8 | 440 |
| Decile 7 | 432 |
| Decile 6 | 426 |
| Median | 420 |
| Decile 4 | 415 |
| Decile 3 | 409 |
| Decile 2 | 402 |
| Decile 1 | 393 |
| Minimum | 174 |
|
|
- There are 151 distinct values.
- Mean = 421.564
- Std.dev = 24.684
- 1 item below graph minimum of 335
- 7 items above graph maximum of 510
|
Notes
QTC interval during ECG
0 Related Data-Fields
There are no related data-fields