Data
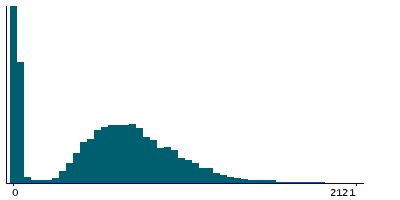
19,783 items of data are available, covering 18,970 participants.
Defined-instances run from 2 to 3, labelled using Instancing
2.
Units of measurement are seconds.
| Maximum | 3987 |
| Decile 9 | 1098 |
| Decile 8 | 929 |
| Decile 7 | 824 |
| Decile 6 | 747 |
| Median | 677 |
| Decile 4 | 603 |
| Decile 3 | 515.5 |
| Decile 2 | 406.5 |
| Decile 1 | 25 |
| Minimum | 6 |
|

|
- There are 1666 distinct values.
- Mean = 663.113
- Std.dev = 366.665
- 12 items above graph maximum of 2171
|
2 Instances
Instance 2 : Imaging visit (2014+)
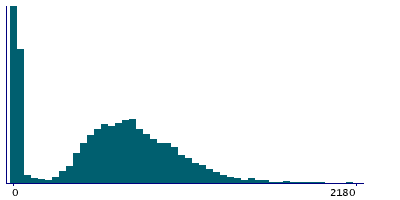
4,182 participants, 4,182 items
| Maximum | 2431 |
| Decile 9 | 1101.5 |
| Decile 8 | 945 |
| Decile 7 | 824.5 |
| Decile 6 | 731 |
| Median | 646 |
| Decile 4 | 548 |
| Decile 3 | 431.5 |
| Decile 2 | 30 |
| Decile 1 | 17 |
| Minimum | 7 |
|

|
- There are 1152 distinct values.
- Mean = 604.287
- Std.dev = 412.244
- 3 items above graph maximum of 2186
|
Instance 3 : First repeat imaging visit (2019+)
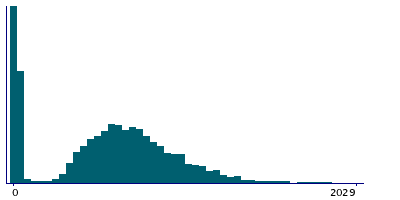
15,601 participants, 15,601 items
| Maximum | 3987 |
| Decile 9 | 1097 |
| Decile 8 | 924 |
| Decile 7 | 824 |
| Decile 6 | 750 |
| Median | 683 |
| Decile 4 | 616 |
| Decile 3 | 532 |
| Decile 2 | 433 |
| Decile 1 | 100 |
| Minimum | 6 |
|

|
- There are 1590 distinct values.
- Mean = 678.882
- Std.dev = 351.782
- 10 items above graph maximum of 2094
|
Notes
Eye measures duration
0 Related Data-Fields
There are no related data-fields
0 Resources
There are no matching Resources


