Data
71,730 items of data are available, covering 67,287 participants.
Defined-instances run from 2 to 3, labelled using Instancing
2.
Units of measurement are g.
| Maximum | 5157 |
| Decile 9 | 3406 |
| Decile 8 | 3152 |
| Decile 7 | 2950 |
| Decile 6 | 2754 |
| Median | 2550 |
| Decile 4 | 2361 |
| Decile 3 | 2200 |
| Decile 2 | 2043 |
| Decile 1 | 1874 |
| Minimum | 0 |
|
|
- There are 3036 distinct values.
- Mean = 2604.06
- Std.dev = 590.612
- 4 items above graph maximum of 4938
|
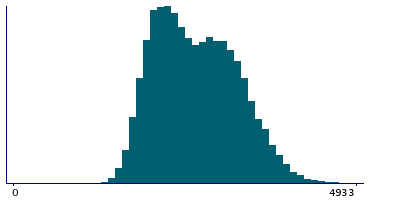
2 Instances
Instance 2 : Imaging visit (2014+)
65,369 participants, 65,369 items
| Maximum | 5157 |
| Decile 9 | 3405.5 |
| Decile 8 | 3151 |
| Decile 7 | 2949 |
| Decile 6 | 2752 |
| Median | 2548 |
| Decile 4 | 2359 |
| Decile 3 | 2198 |
| Decile 2 | 2042 |
| Decile 1 | 1873 |
| Minimum | 0 |
|

|
- There are 3006 distinct values.
- Mean = 2602.96
- Std.dev = 590.931
- 4 items above graph maximum of 4938
|
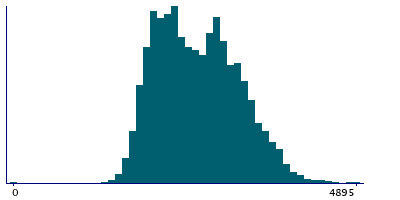
Instance 3 : First repeat imaging visit (2019+)
6,361 participants, 6,361 items
| Maximum | 4895 |
| Decile 9 | 3408 |
| Decile 8 | 3166 |
| Decile 7 | 2958 |
| Decile 6 | 2771 |
| Median | 2566.5 |
| Decile 4 | 2378.5 |
| Decile 3 | 2221 |
| Decile 2 | 2053 |
| Decile 1 | 1883.5 |
| Minimum | 0 |
|
|
- There are 2145 distinct values.
- Mean = 2615.35
- Std.dev = 587.203
|
Notes
Value output by DXA system. Field 21122 Total bone mass was originally incorrectly named as Femur total bone mass, corrected Q2 2024.
0 Related Data-Fields
There are no related data-fields
0 Resources
There are no matching Resources
