Data
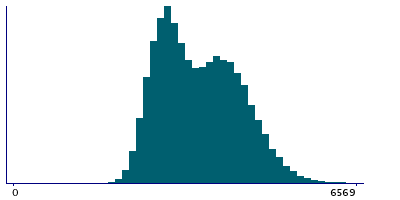
39,096 items of data are available, covering 36,087 participants.
Defined-instances run from 2 to 3, labelled using Instancing
2.
Units of measurement are g.
| Maximum | 7207 |
| Decile 9 | 4600 |
| Decile 8 | 4264 |
| Decile 7 | 4001.5 |
| Decile 6 | 3751 |
| Median | 3478 |
| Decile 4 | 3223 |
| Decile 3 | 3018 |
| Decile 2 | 2839.5 |
| Decile 1 | 2631 |
| Minimum | 0 |
|

|
- There are 3609 distinct values.
- Mean = 3557.74
- Std.dev = 765.151
- 9 items above graph maximum of 6569
|
2 Instances
Instance 2 : Imaging visit (2014+)
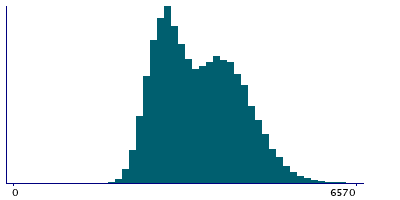
35,081 participants, 35,081 items
| Maximum | 7207 |
| Decile 9 | 4598 |
| Decile 8 | 4263 |
| Decile 7 | 3999 |
| Decile 6 | 3750 |
| Median | 3475 |
| Decile 4 | 3221 |
| Decile 3 | 3014 |
| Decile 2 | 2835 |
| Decile 1 | 2627 |
| Minimum | 0 |
|

|
- There are 3557 distinct values.
- Mean = 3554.79
- Std.dev = 766.21
- 9 items above graph maximum of 6569
|
Instance 3 : First repeat imaging visit (2019+)
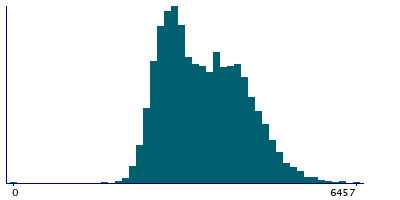
4,015 participants, 4,015 items
| Maximum | 6457 |
| Decile 9 | 4614.5 |
| Decile 8 | 4275 |
| Decile 7 | 4019 |
| Decile 6 | 3768 |
| Median | 3498.5 |
| Decile 4 | 3241 |
| Decile 3 | 3053.5 |
| Decile 2 | 2873 |
| Decile 1 | 2677 |
| Minimum | 0 |
|

|
- There are 2136 distinct values.
- Mean = 3583.53
- Std.dev = 755.336
|
Notes
Value output by DXA system
0 Related Data-Fields
There are no related data-fields
0 Resources
There are no matching Resources


